AmpcoPittsburgh AP full analysis,charts,indicators,moving averages,SMA,DMA,EMA,ADX,MACD,RSIAmpco Pittsburgh AP WideScreen charts, DMA,SMA,EMA technical analysis, forecast prediction, by indicators ADX,MACD,RSI,CCI NYSE stock exchange
operates under Capital Goods sector & deals in Fluid Controls
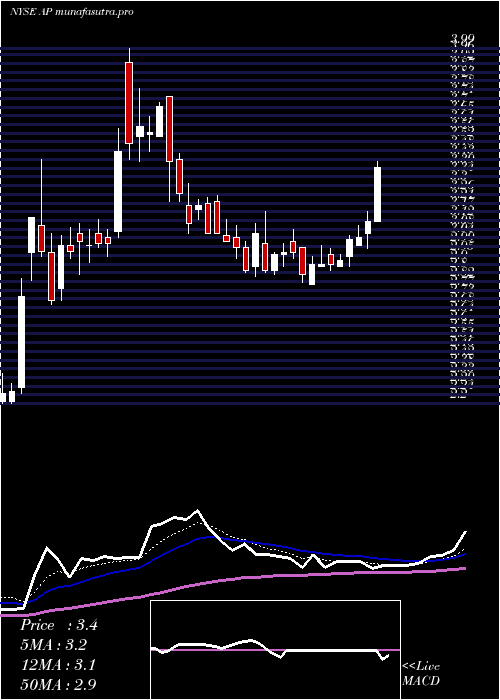
Daily price and charts and targets AmpcoPittsburgh Strong Daily Stock price targets for AmpcoPittsburgh AP are 2.83 and 3.18 | Daily Target 1 | 2.55 | | Daily Target 2 | 2.76 | | Daily Target 3 | 2.9033333333333 | | Daily Target 4 | 3.11 | | Daily Target 5 | 3.25 |
Daily price and volume Ampco Pittsburgh
| Date |
Closing |
Open |
Range |
Volume |
Thu 04 December 2025 |
2.96 (8.03%) |
2.74 |
2.70 - 3.05 |
1.1413 times |
Wed 03 December 2025 |
2.74 (0%) |
2.71 |
2.69 - 2.86 |
1.2999 times |
Tue 02 December 2025 |
2.74 (10.48%) |
2.57 |
2.53 - 2.95 |
1.7628 times |
Mon 01 December 2025 |
2.48 (-4.25%) |
2.53 |
2.46 - 2.63 |
0.7641 times |
Fri 28 November 2025 |
2.59 (-3.72%) |
2.75 |
2.50 - 2.79 |
1.4914 times |
Wed 26 November 2025 |
2.69 (9.8%) |
2.45 |
2.39 - 2.99 |
1.9049 times |
Tue 25 November 2025 |
2.45 (1.24%) |
2.47 |
2.42 - 2.60 |
0.2746 times |
Mon 24 November 2025 |
2.42 (2.11%) |
2.33 |
2.33 - 2.47 |
0.4283 times |
Fri 21 November 2025 |
2.37 (-3.27%) |
2.50 |
2.36 - 2.55 |
0.406 times |
Thu 20 November 2025 |
2.45 (-4.3%) |
2.50 |
2.44 - 2.66 |
0.5268 times |
Wed 19 November 2025 |
2.56 (-2.29%) |
2.69 |
2.44 - 2.74 |
0.6906 times |
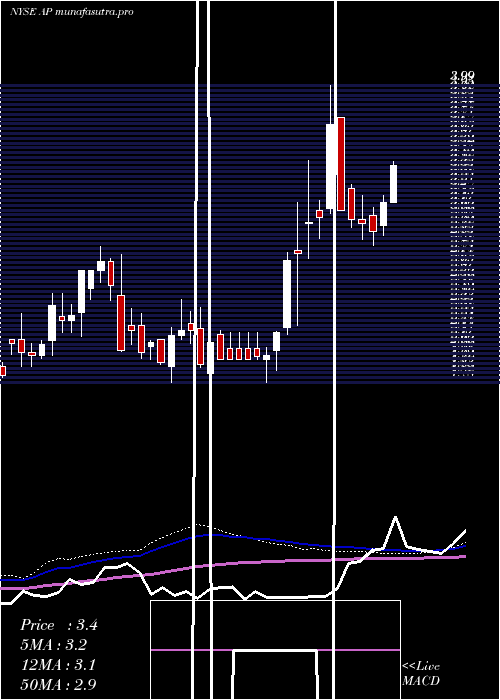
Weekly price and charts AmpcoPittsburgh Strong weekly Stock price targets for AmpcoPittsburgh AP are 2.71 and 3.3 | Weekly Target 1 | 2.23 | | Weekly Target 2 | 2.6 | | Weekly Target 3 | 2.8233333333333 | | Weekly Target 4 | 3.19 | | Weekly Target 5 | 3.41 |
Weekly price and volumes for Ampco Pittsburgh
| Date |
Closing |
Open |
Range |
Volume |
Thu 04 December 2025 |
2.96 (14.29%) |
2.53 |
2.46 - 3.05 |
1.7165 times |
Fri 28 November 2025 |
2.59 (9.28%) |
2.33 |
2.33 - 2.99 |
1.4163 times |
Fri 21 November 2025 |
2.37 (-3.66%) |
2.42 |
2.36 - 2.83 |
1.5998 times |
Fri 14 November 2025 |
2.46 (32.97%) |
1.84 |
1.75 - 2.70 |
3.0636 times |
Fri 07 November 2025 |
1.85 (-11.9%) |
2.00 |
1.80 - 2.10 |
0.243 times |
Fri 31 October 2025 |
2.10 (0%) |
2.20 |
2.07 - 2.25 |
0.0487 times |
Fri 31 October 2025 |
2.10 (-7.49%) |
2.27 |
2.07 - 2.36 |
0.3658 times |
Fri 24 October 2025 |
2.27 (10.73%) |
1.97 |
1.91 - 2.35 |
0.7215 times |
Fri 17 October 2025 |
2.05 (-6.39%) |
2.19 |
2.01 - 2.41 |
0.4932 times |
Fri 10 October 2025 |
2.19 (-1.35%) |
2.38 |
2.15 - 2.38 |
0.3315 times |
Fri 03 October 2025 |
2.22 (-8.26%) |
2.40 |
2.17 - 2.54 |
0.3129 times |
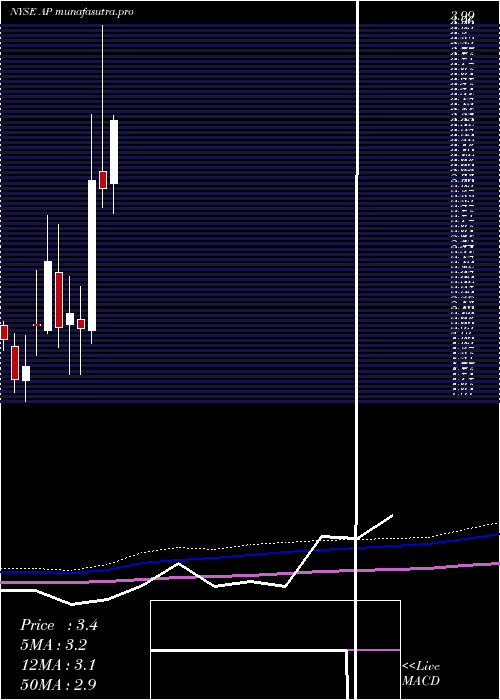
Monthly price and charts AmpcoPittsburgh Strong monthly Stock price targets for AmpcoPittsburgh AP are 2.71 and 3.3 | Monthly Target 1 | 2.23 | | Monthly Target 2 | 2.6 | | Monthly Target 3 | 2.8233333333333 | | Monthly Target 4 | 3.19 | | Monthly Target 5 | 3.41 |
Monthly price and volumes Ampco Pittsburgh
| Date |
Closing |
Open |
Range |
Volume |
Thu 04 December 2025 |
2.96 (14.29%) |
2.53 |
2.46 - 3.05 |
0.6732 times |
Fri 28 November 2025 |
2.59 (23.33%) |
2.00 |
1.75 - 2.99 |
2.4796 times |
Fri 31 October 2025 |
2.10 (-8.3%) |
2.24 |
1.91 - 2.41 |
0.8395 times |
Tue 30 September 2025 |
2.29 (-15.81%) |
2.70 |
2.16 - 2.90 |
0.9352 times |
Fri 29 August 2025 |
2.72 (-15.79%) |
3.08 |
2.70 - 3.59 |
0.7218 times |
Thu 31 July 2025 |
3.23 (9.12%) |
2.99 |
2.80 - 3.99 |
1.0752 times |
Mon 30 June 2025 |
2.96 (-1.66%) |
3.07 |
2.84 - 3.99 |
1.332 times |
Fri 30 May 2025 |
3.01 (45.41%) |
2.06 |
1.98 - 3.43 |
0.9983 times |
Wed 30 April 2025 |
2.07 (-4.61%) |
2.13 |
1.78 - 2.34 |
0.5107 times |
Mon 31 March 2025 |
2.17 (4.33%) |
2.10 |
1.78 - 2.40 |
0.4345 times |
Fri 28 February 2025 |
2.08 (-16.8%) |
2.43 |
1.95 - 2.73 |
0.4107 times |
DMA SMA EMA moving averages of Ampco Pittsburgh AP
DMA (daily moving average) of Ampco Pittsburgh AP
| DMA period | DMA value | | 5 day DMA | 2.7 | | 12 day DMA | 2.59 | | 20 day DMA | 2.4 | | 35 day DMA | 2.3 | | 50 day DMA | 2.3 | | 100 day DMA | 2.64 | | 150 day DMA | 2.74 | | 200 day DMA | 2.56 | EMA (exponential moving average) of Ampco Pittsburgh AP
| EMA period | EMA current | EMA prev | EMA prev2 | | 5 day EMA | 2.75 | 2.64 | 2.59 | | 12 day EMA | 2.6 | 2.53 | 2.49 | | 20 day EMA | 2.49 | 2.44 | 2.41 | | 35 day EMA | 2.42 | 2.39 | 2.37 | | 50 day EMA | 2.35 | 2.32 | 2.3 |
SMA (simple moving average) of Ampco Pittsburgh AP
| SMA period | SMA current | SMA prev | SMA prev2 | | 5 day SMA | 2.7 | 2.65 | 2.59 | | 12 day SMA | 2.59 | 2.57 | 2.54 | | 20 day SMA | 2.4 | 2.35 | 2.32 | | 35 day SMA | 2.3 | 2.28 | 2.26 | | 50 day SMA | 2.3 | 2.28 | 2.27 | | 100 day SMA | 2.64 | 2.65 | 2.65 | | 150 day SMA | 2.74 | 2.73 | 2.73 | | 200 day SMA | 2.56 | 2.55 | 2.55 |
|
|
