AutonationInc AN full analysis,charts,indicators,moving averages,SMA,DMA,EMA,ADX,MACD,RSIAutonation Inc AN WideScreen charts, DMA,SMA,EMA technical analysis, forecast prediction, by indicators ADX,MACD,RSI,CCI NYSE stock exchange
operates under Consumer Durables sector & deals in Automotive Aftermarket
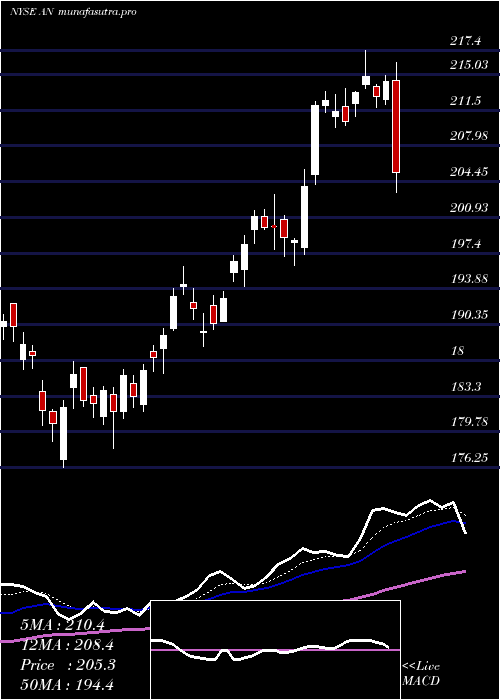
Daily price and charts and targets AutonationInc Strong Daily Stock price targets for AutonationInc AN are 216.98 and 222.35 | Daily Target 1 | 212.83 | | Daily Target 2 | 215.76 | | Daily Target 3 | 218.19666666667 | | Daily Target 4 | 221.13 | | Daily Target 5 | 223.57 |
Daily price and volume Autonation Inc
| Date |
Closing |
Open |
Range |
Volume |
Tue 21 October 2025 |
218.70 (0.96%) |
215.26 |
215.26 - 220.63 |
1.0525 times |
Mon 20 October 2025 |
216.62 (0.89%) |
215.40 |
213.46 - 219.71 |
1.314 times |
Fri 17 October 2025 |
214.71 (0.5%) |
214.67 |
213.40 - 217.24 |
1.1234 times |
Thu 16 October 2025 |
213.64 (-1.38%) |
217.27 |
213.61 - 217.50 |
0.9483 times |
Wed 15 October 2025 |
216.63 (-1.97%) |
217.55 |
216.31 - 221.53 |
1.0616 times |
Tue 14 October 2025 |
220.99 (2.38%) |
213.75 |
213.54 - 222.66 |
1.1672 times |
Mon 13 October 2025 |
215.85 (0.31%) |
214.10 |
214.10 - 217.87 |
1.0528 times |
Tue 07 October 2025 |
215.18 (-1.97%) |
218.81 |
215.04 - 220.03 |
0.8587 times |
Mon 06 October 2025 |
219.50 (-2.17%) |
223.87 |
219.35 - 224.82 |
0.5993 times |
Fri 03 October 2025 |
224.38 (0.21%) |
225.09 |
223.25 - 226.63 |
0.8222 times |
Thu 02 October 2025 |
223.92 (0.17%) |
223.95 |
220.53 - 224.84 |
0.4131 times |
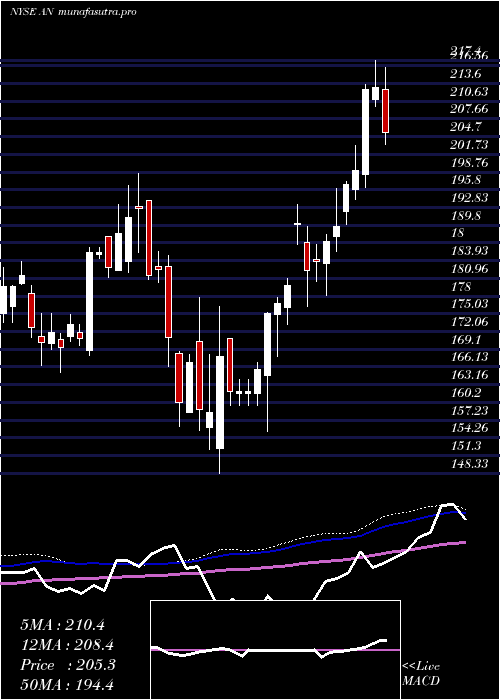
Weekly price and charts AutonationInc Strong weekly Stock price targets for AutonationInc AN are 216.08 and 223.25 | Weekly Target 1 | 210.43 | | Weekly Target 2 | 214.56 | | Weekly Target 3 | 217.59666666667 | | Weekly Target 4 | 221.73 | | Weekly Target 5 | 224.77 |
Weekly price and volumes for Autonation Inc
| Date |
Closing |
Open |
Range |
Volume |
Tue 21 October 2025 |
218.70 (1.86%) |
215.40 |
213.46 - 220.63 |
0.5152 times |
Fri 17 October 2025 |
214.71 (-0.22%) |
214.10 |
213.40 - 222.66 |
1.1653 times |
Tue 07 October 2025 |
215.18 (-4.1%) |
223.87 |
215.04 - 224.82 |
0.3174 times |
Fri 03 October 2025 |
224.38 (3.09%) |
219.69 |
214.93 - 226.63 |
1.0517 times |
Fri 26 September 2025 |
217.66 (-0.07%) |
217.00 |
208.39 - 224.07 |
1.3983 times |
Fri 19 September 2025 |
217.82 (-1.87%) |
221.71 |
217.64 - 226.39 |
1.5304 times |
Fri 12 September 2025 |
221.98 (-2.13%) |
228.11 |
221.44 - 228.21 |
1.6578 times |
Fri 05 September 2025 |
226.82 (3.53%) |
216.79 |
215.98 - 228.92 |
0.979 times |
Fri 29 August 2025 |
219.08 (0%) |
222.72 |
218.20 - 223.00 |
0.1966 times |
Fri 29 August 2025 |
219.08 (0.13%) |
217.87 |
216.76 - 224.00 |
1.1883 times |
Fri 22 August 2025 |
218.80 (6.12%) |
205.26 |
205.26 - 220.00 |
0.9616 times |
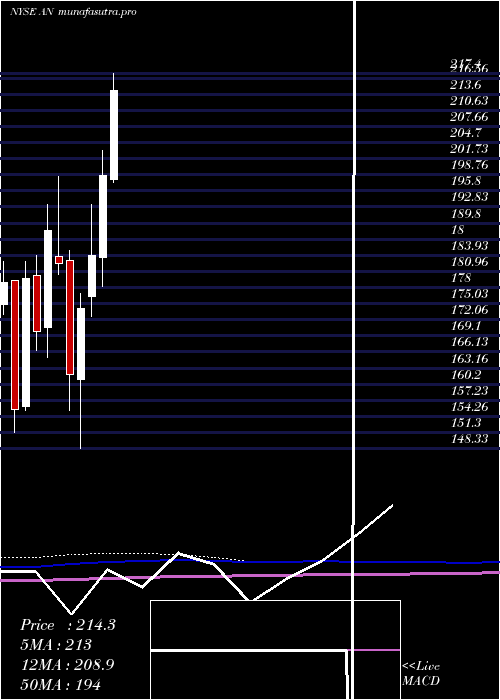
Monthly price and charts AutonationInc Strong monthly Stock price targets for AutonationInc AN are 216.05 and 229.28 | Monthly Target 1 | 206.35 | | Monthly Target 2 | 212.52 | | Monthly Target 3 | 219.57666666667 | | Monthly Target 4 | 225.75 | | Monthly Target 5 | 232.81 |
Monthly price and volumes Autonation Inc
| Date |
Closing |
Open |
Range |
Volume |
Tue 21 October 2025 |
218.70 (-0.03%) |
218.01 |
213.40 - 226.63 |
0.4496 times |
Tue 30 September 2025 |
218.77 (-0.14%) |
216.79 |
208.39 - 228.92 |
1.0855 times |
Fri 29 August 2025 |
219.08 (13.73%) |
190.61 |
188.32 - 224.00 |
0.843 times |
Thu 31 July 2025 |
192.64 (-3.03%) |
197.93 |
190.41 - 217.40 |
1.3614 times |
Mon 30 June 2025 |
198.65 (8.05%) |
183.48 |
178.17 - 203.18 |
0.8023 times |
Fri 30 May 2025 |
183.85 (5.57%) |
176.26 |
172.70 - 193.24 |
0.9162 times |
Wed 30 April 2025 |
174.15 (7.55%) |
161.05 |
148.33 - 176.83 |
1.3471 times |
Mon 31 March 2025 |
161.92 (-11.21%) |
183.00 |
155.40 - 184.79 |
1.2163 times |
Fri 28 February 2025 |
182.37 (-3.28%) |
183.71 |
180.31 - 198.50 |
1.0306 times |
Fri 31 January 2025 |
188.55 (11.02%) |
170.66 |
165.15 - 193.36 |
0.9481 times |
Tue 31 December 2024 |
169.84 (-5.47%) |
180.16 |
166.45 - 183.82 |
0.7827 times |
DMA SMA EMA moving averages of Autonation Inc AN
DMA (daily moving average) of Autonation Inc AN
| DMA period | DMA value | | 5 day DMA | 216.06 | | 12 day DMA | 218.64 | | 20 day DMA | 218.58 | | 35 day DMA | 220.25 | | 50 day DMA | 217.52 | | 100 day DMA | 207.19 | | 150 day DMA | 195.14 | | 200 day DMA | 191.77 | EMA (exponential moving average) of Autonation Inc AN
| EMA period | EMA current | EMA prev | EMA prev2 | | 5 day EMA | 217.07 | 216.25 | 216.06 | | 12 day EMA | 217.74 | 217.57 | 217.74 | | 20 day EMA | 218.09 | 218.03 | 218.18 | | 35 day EMA | 216.75 | 216.63 | 216.63 | | 50 day EMA | 215.42 | 215.29 | 215.24 |
SMA (simple moving average) of Autonation Inc AN
| SMA period | SMA current | SMA prev | SMA prev2 | | 5 day SMA | 216.06 | 216.52 | 216.36 | | 12 day SMA | 218.64 | 218.65 | 218.71 | | 20 day SMA | 218.58 | 218.7 | 218.9 | | 35 day SMA | 220.25 | 220.35 | 220.51 | | 50 day SMA | 217.52 | 217.03 | 216.61 | | 100 day SMA | 207.19 | 206.81 | 206.46 | | 150 day SMA | 195.14 | 194.79 | 194.44 | | 200 day SMA | 191.77 | 191.52 | 191.3 |
|
|
