AmnHealthcare AMN full analysis,charts,indicators,moving averages,SMA,DMA,EMA,ADX,MACD,RSIAmn Healthcare AMN WideScreen charts, DMA,SMA,EMA technical analysis, forecast prediction, by indicators ADX,MACD,RSI,CCI NYSE stock exchange
operates under Technology sector & deals in Professional Services
Daily price and charts and targets AmnHealthcare Strong Daily Stock price targets for AmnHealthcare AMN are 15.92 and 16.53 | Daily Target 1 | 15.81 | | Daily Target 2 | 16.03 | | Daily Target 3 | 16.416666666667 | | Daily Target 4 | 16.64 | | Daily Target 5 | 17.03 |
Daily price and volume Amn Healthcare
| Date |
Closing |
Open |
Range |
Volume |
Fri 05 December 2025 |
16.26 (-1.87%) |
16.65 |
16.19 - 16.80 |
0.881 times |
Thu 04 December 2025 |
16.57 (-0.72%) |
16.65 |
16.33 - 16.70 |
1.0952 times |
Wed 03 December 2025 |
16.69 (-0.65%) |
16.67 |
16.44 - 16.85 |
0.8773 times |
Tue 02 December 2025 |
16.80 (-0.88%) |
17.09 |
16.65 - 17.17 |
0.594 times |
Mon 01 December 2025 |
16.95 (1.8%) |
16.52 |
16.51 - 17.08 |
1.157 times |
Fri 28 November 2025 |
16.65 (-3.31%) |
17.05 |
16.49 - 17.16 |
0.5812 times |
Wed 26 November 2025 |
17.22 (-1.54%) |
17.24 |
17.22 - 17.55 |
0.7664 times |
Tue 25 November 2025 |
17.49 (2.52%) |
17.23 |
17.11 - 17.55 |
1.0729 times |
Mon 24 November 2025 |
17.06 (3.27%) |
16.52 |
16.27 - 17.13 |
1.5487 times |
Fri 21 November 2025 |
16.52 (7.69%) |
15.56 |
15.36 - 16.77 |
1.4264 times |
Thu 20 November 2025 |
15.34 (-2.79%) |
15.95 |
15.28 - 16.23 |
1.0228 times |
Weekly price and charts AmnHealthcare Strong weekly Stock price targets for AmnHealthcare AMN are 15.74 and 16.72 | Weekly Target 1 | 15.56 | | Weekly Target 2 | 15.91 | | Weekly Target 3 | 16.54 | | Weekly Target 4 | 16.89 | | Weekly Target 5 | 17.52 |
Weekly price and volumes for Amn Healthcare
| Date |
Closing |
Open |
Range |
Volume |
Fri 05 December 2025 |
16.26 (-2.34%) |
16.52 |
16.19 - 17.17 |
1.036 times |
Fri 28 November 2025 |
16.65 (0.79%) |
16.52 |
16.27 - 17.55 |
0.8931 times |
Fri 21 November 2025 |
16.52 (3.96%) |
15.87 |
15.28 - 16.77 |
1.3831 times |
Fri 14 November 2025 |
15.89 (-11.08%) |
18.25 |
15.30 - 18.25 |
2.0373 times |
Fri 07 November 2025 |
17.87 (-9.24%) |
19.44 |
16.73 - 20.90 |
1.5843 times |
Fri 31 October 2025 |
19.69 (0%) |
19.75 |
19.10 - 19.75 |
0.192 times |
Fri 31 October 2025 |
19.69 (-6.99%) |
21.50 |
19.10 - 21.61 |
0.9729 times |
Fri 24 October 2025 |
21.17 (7.63%) |
19.81 |
19.69 - 21.38 |
0.7102 times |
Fri 17 October 2025 |
19.67 (1.39%) |
18.70 |
18.55 - 21.00 |
0.859 times |
Tue 07 October 2025 |
19.40 (-5.5%) |
20.70 |
19.37 - 21.12 |
0.3322 times |
Fri 03 October 2025 |
20.53 (8.8%) |
19.09 |
18.29 - 20.54 |
0.9266 times |

Monthly price and charts AmnHealthcare Strong monthly Stock price targets for AmnHealthcare AMN are 15.74 and 16.72 | Monthly Target 1 | 15.56 | | Monthly Target 2 | 15.91 | | Monthly Target 3 | 16.54 | | Monthly Target 4 | 16.89 | | Monthly Target 5 | 17.52 |
Monthly price and volumes Amn Healthcare
| Date |
Closing |
Open |
Range |
Volume |
Fri 05 December 2025 |
16.26 (-2.34%) |
16.52 |
16.19 - 17.17 |
0.243 times |
Fri 28 November 2025 |
16.65 (-15.44%) |
19.44 |
15.28 - 20.90 |
1.383 times |
Fri 31 October 2025 |
19.69 (1.7%) |
19.35 |
18.55 - 21.61 |
0.8505 times |
Tue 30 September 2025 |
19.36 (-6.83%) |
20.74 |
17.69 - 21.23 |
1.2873 times |
Fri 29 August 2025 |
20.78 (13.3%) |
18.19 |
14.86 - 21.26 |
1.4734 times |
Thu 31 July 2025 |
18.34 (-11.27%) |
20.55 |
17.92 - 22.76 |
0.878 times |
Mon 30 June 2025 |
20.67 (-2.08%) |
21.04 |
19.95 - 22.55 |
0.766 times |
Fri 30 May 2025 |
21.11 (3.33%) |
20.68 |
19.39 - 23.74 |
1.0251 times |
Wed 30 April 2025 |
20.43 (-16.48%) |
24.72 |
17.45 - 24.72 |
0.9889 times |
Mon 31 March 2025 |
24.46 (-3.4%) |
25.09 |
23.00 - 27.17 |
1.1049 times |
Fri 28 February 2025 |
25.32 (-7.99%) |
26.93 |
22.72 - 30.49 |
1.434 times |

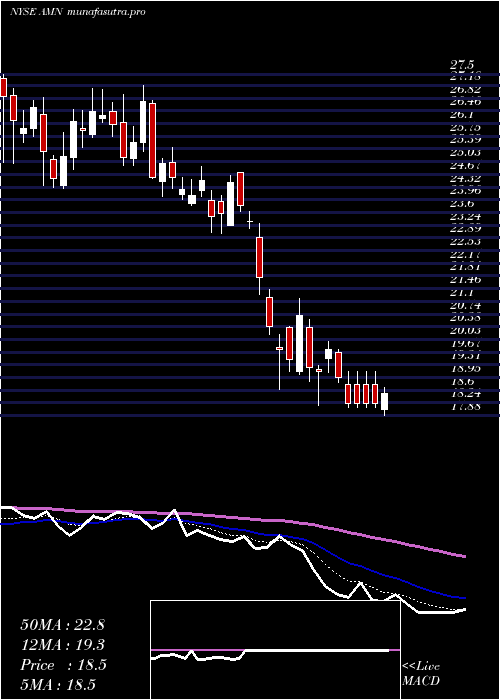
DMA SMA EMA moving averages of Amn Healthcare AMN
DMA (daily moving average) of Amn Healthcare AMN
| DMA period | DMA value | | 5 day DMA | 16.65 | | 12 day DMA | 16.61 | | 20 day DMA | 16.59 | | 35 day DMA | 18.1 | | 50 day DMA | 18.49 | | 100 day DMA | 18.92 | | 150 day DMA | 19.73 | | 200 day DMA | 20.51 | EMA (exponential moving average) of Amn Healthcare AMN
| EMA period | EMA current | EMA prev | EMA prev2 | | 5 day EMA | 16.57 | 16.72 | 16.79 | | 12 day EMA | 16.73 | 16.82 | 16.86 | | 20 day EMA | 17.04 | 17.12 | 17.18 | | 35 day EMA | 17.55 | 17.63 | 17.69 | | 50 day EMA | 18.34 | 18.42 | 18.5 |
SMA (simple moving average) of Amn Healthcare AMN
| SMA period | SMA current | SMA prev | SMA prev2 | | 5 day SMA | 16.65 | 16.73 | 16.86 | | 12 day SMA | 16.61 | 16.58 | 16.53 | | 20 day SMA | 16.59 | 16.7 | 16.9 | | 35 day SMA | 18.1 | 18.2 | 18.31 | | 50 day SMA | 18.49 | 18.54 | 18.59 | | 100 day SMA | 18.92 | 18.97 | 19.03 | | 150 day SMA | 19.73 | 19.75 | 19.77 | | 200 day SMA | 20.51 | 20.54 | 20.58 |
|
|
