AmtekInc AME full analysis,charts,indicators,moving averages,SMA,DMA,EMA,ADX,MACD,RSIAmtek Inc AME WideScreen charts, DMA,SMA,EMA technical analysis, forecast prediction, by indicators ADX,MACD,RSI,CCI NYSE stock exchange
operates under Consumer Durables sector & deals in Metal Fabrications
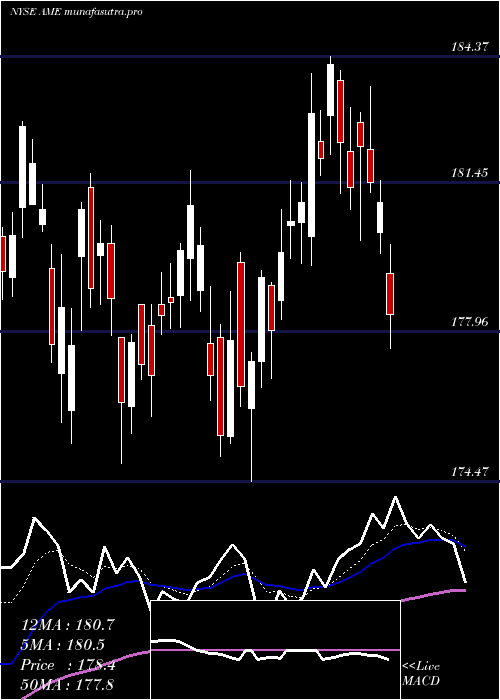
Daily price and charts and targets AmtekInc Strong Daily Stock price targets for AmtekInc AME are 199.06 and 202.13 | Daily Target 1 | 196.77 | | Daily Target 2 | 198.28 | | Daily Target 3 | 199.83666666667 | | Daily Target 4 | 201.35 | | Daily Target 5 | 202.91 |
Daily price and volume Amtek Inc
| Date |
Closing |
Open |
Range |
Volume |
Fri 05 December 2025 |
199.80 (0.29%) |
199.04 |
198.32 - 201.39 |
1.1306 times |
Thu 04 December 2025 |
199.22 (0%) |
199.13 |
198.34 - 200.88 |
0.7451 times |
Wed 03 December 2025 |
199.22 (0.98%) |
196.86 |
195.68 - 199.36 |
0.6951 times |
Tue 02 December 2025 |
197.29 (0.86%) |
196.18 |
195.30 - 198.27 |
0.9164 times |
Mon 01 December 2025 |
195.61 (-1.15%) |
196.46 |
195.57 - 198.27 |
0.9547 times |
Fri 28 November 2025 |
197.89 (0.82%) |
196.42 |
196.10 - 198.53 |
0.655 times |
Wed 26 November 2025 |
196.28 (-0.48%) |
196.95 |
196.25 - 197.90 |
1.2141 times |
Tue 25 November 2025 |
197.22 (1.02%) |
196.56 |
194.50 - 198.11 |
0.8827 times |
Mon 24 November 2025 |
195.22 (0.1%) |
194.74 |
194.01 - 195.99 |
1.6444 times |
Fri 21 November 2025 |
195.02 (2.63%) |
190.41 |
190.25 - 196.00 |
1.162 times |
Thu 20 November 2025 |
190.02 (-0.81%) |
193.89 |
189.06 - 194.91 |
1.1721 times |
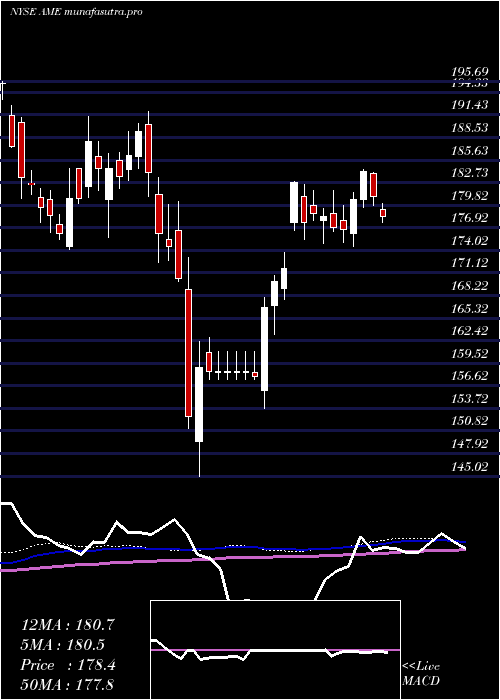
Weekly price and charts AmtekInc Strong weekly Stock price targets for AmtekInc AME are 197.55 and 203.64 | Weekly Target 1 | 192.74 | | Weekly Target 2 | 196.27 | | Weekly Target 3 | 198.83 | | Weekly Target 4 | 202.36 | | Weekly Target 5 | 204.92 |
Weekly price and volumes for Amtek Inc
| Date |
Closing |
Open |
Range |
Volume |
Fri 05 December 2025 |
199.80 (0.97%) |
196.46 |
195.30 - 201.39 |
0.9967 times |
Fri 28 November 2025 |
197.89 (1.47%) |
194.74 |
194.01 - 198.53 |
0.9864 times |
Fri 21 November 2025 |
195.02 (0.86%) |
193.89 |
188.47 - 196.00 |
1.2862 times |
Fri 14 November 2025 |
193.36 (-1.49%) |
196.70 |
192.15 - 200.71 |
1.1567 times |
Fri 07 November 2025 |
196.29 (-2.88%) |
196.99 |
193.98 - 199.81 |
0.7451 times |
Fri 31 October 2025 |
202.11 (0%) |
198.77 |
197.77 - 204.15 |
0.4573 times |
Fri 31 October 2025 |
202.11 (8%) |
187.38 |
182.87 - 204.15 |
1.8256 times |
Fri 24 October 2025 |
187.14 (0.9%) |
186.97 |
184.89 - 189.95 |
0.762 times |
Fri 17 October 2025 |
185.47 (3.45%) |
180.14 |
179.79 - 188.17 |
0.8739 times |
Fri 10 October 2025 |
179.28 (-2.43%) |
187.00 |
179.24 - 187.09 |
0.9101 times |
Fri 03 October 2025 |
183.75 (-1.41%) |
187.73 |
183.56 - 189.18 |
1.0634 times |
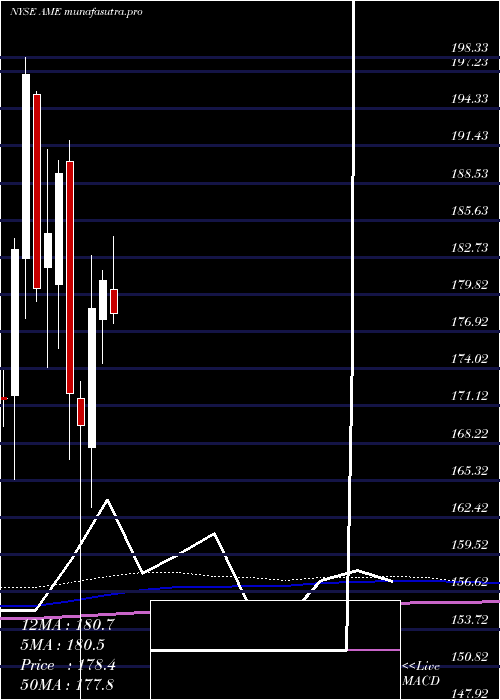
Monthly price and charts AmtekInc Strong monthly Stock price targets for AmtekInc AME are 197.55 and 203.64 | Monthly Target 1 | 192.74 | | Monthly Target 2 | 196.27 | | Monthly Target 3 | 198.83 | | Monthly Target 4 | 202.36 | | Monthly Target 5 | 204.92 |
Monthly price and volumes Amtek Inc
| Date |
Closing |
Open |
Range |
Volume |
Fri 05 December 2025 |
199.80 (0.97%) |
196.46 |
195.30 - 201.39 |
0.24 times |
Fri 28 November 2025 |
197.89 (-2.09%) |
196.99 |
188.47 - 200.71 |
1.0051 times |
Fri 31 October 2025 |
202.11 (7.51%) |
186.88 |
179.24 - 204.15 |
1.2962 times |
Tue 30 September 2025 |
188.00 (1.73%) |
183.95 |
182.26 - 192.33 |
0.9523 times |
Fri 29 August 2025 |
184.80 (-0.03%) |
183.02 |
179.90 - 190.00 |
0.9471 times |
Thu 31 July 2025 |
184.85 (2.15%) |
180.18 |
174.43 - 189.20 |
1.2221 times |
Mon 30 June 2025 |
180.96 (1.24%) |
177.84 |
174.47 - 181.73 |
1.0261 times |
Fri 30 May 2025 |
178.74 (5.4%) |
167.92 |
163.20 - 182.88 |
1.0357 times |
Wed 30 April 2025 |
169.58 (-1.49%) |
171.74 |
145.02 - 173.08 |
1.2947 times |
Mon 31 March 2025 |
172.14 (-9.06%) |
190.17 |
166.95 - 191.83 |
0.9807 times |
Fri 28 February 2025 |
189.30 (2.57%) |
180.61 |
175.64 - 190.25 |
1.0477 times |
DMA SMA EMA moving averages of Amtek Inc AME
DMA (daily moving average) of Amtek Inc AME
| DMA period | DMA value | | 5 day DMA | 198.23 | | 12 day DMA | 196.2 | | 20 day DMA | 195.58 | | 35 day DMA | 193.89 | | 50 day DMA | 191.06 | | 100 day DMA | 187.79 | | 150 day DMA | 184.64 | | 200 day DMA | 181.06 | EMA (exponential moving average) of Amtek Inc AME
| EMA period | EMA current | EMA prev | EMA prev2 | | 5 day EMA | 198.58 | 197.97 | 197.34 | | 12 day EMA | 197.01 | 196.5 | 196 | | 20 day EMA | 195.83 | 195.41 | 195.01 | | 35 day EMA | 193.43 | 193.05 | 192.69 | | 50 day EMA | 191.43 | 191.09 | 190.76 |
SMA (simple moving average) of Amtek Inc AME
| SMA period | SMA current | SMA prev | SMA prev2 | | 5 day SMA | 198.23 | 197.85 | 197.26 | | 12 day SMA | 196.2 | 195.37 | 194.7 | | 20 day SMA | 195.58 | 195.46 | 195.4 | | 35 day SMA | 193.89 | 193.45 | 193.07 | | 50 day SMA | 191.06 | 190.75 | 190.49 | | 100 day SMA | 187.79 | 187.56 | 187.33 | | 150 day SMA | 184.64 | 184.42 | 184.22 | | 200 day SMA | 181.06 | 180.99 | 180.94 |
|
|
