AnteroMidstream AM full analysis,charts,indicators,moving averages,SMA,DMA,EMA,ADX,MACD,RSIAntero Midstream AM WideScreen charts, DMA,SMA,EMA technical analysis, forecast prediction, by indicators ADX,MACD,RSI,CCI NYSE stock exchange
operates under Public Utilities sector & deals in Natural Gas Distribution
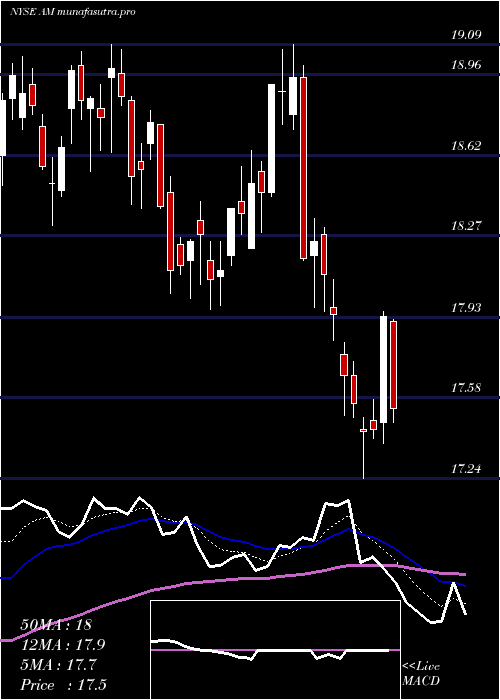
Daily price and charts and targets AnteroMidstream Strong Daily Stock price targets for AnteroMidstream AM are 18.27 and 18.57 | Daily Target 1 | 18.04 | | Daily Target 2 | 18.19 | | Daily Target 3 | 18.336666666667 | | Daily Target 4 | 18.49 | | Daily Target 5 | 18.64 |
Daily price and volume Antero Midstream
| Date |
Closing |
Open |
Range |
Volume |
Mon 20 October 2025 |
18.35 (1.55%) |
18.18 |
18.18 - 18.48 |
0.862 times |
Fri 17 October 2025 |
18.07 (0.61%) |
17.93 |
17.90 - 18.11 |
1.0135 times |
Thu 16 October 2025 |
17.96 (-1.97%) |
18.32 |
17.88 - 18.38 |
0.9223 times |
Wed 15 October 2025 |
18.32 (1.78%) |
18.12 |
18.11 - 18.50 |
0.9733 times |
Tue 14 October 2025 |
18.00 (-2.07%) |
18.20 |
17.97 - 18.29 |
1.1737 times |
Mon 13 October 2025 |
18.38 (-0.16%) |
18.45 |
18.27 - 18.55 |
0.8411 times |
Fri 10 October 2025 |
18.41 (-2.23%) |
18.83 |
18.39 - 19.07 |
0.8242 times |
Thu 09 October 2025 |
18.83 (-2.69%) |
19.42 |
18.82 - 19.46 |
1.1195 times |
Wed 08 October 2025 |
19.35 (1.15%) |
19.06 |
18.88 - 19.38 |
1.0178 times |
Tue 07 October 2025 |
19.13 (0.31%) |
19.10 |
18.86 - 19.16 |
1.2526 times |
Mon 06 October 2025 |
19.07 (-0.1%) |
19.10 |
18.94 - 19.22 |
1.0571 times |
Weekly price and charts AnteroMidstream Strong weekly Stock price targets for AnteroMidstream AM are 18.27 and 18.57 | Weekly Target 1 | 18.04 | | Weekly Target 2 | 18.19 | | Weekly Target 3 | 18.336666666667 | | Weekly Target 4 | 18.49 | | Weekly Target 5 | 18.64 |
Weekly price and volumes for Antero Midstream
| Date |
Closing |
Open |
Range |
Volume |
Mon 20 October 2025 |
18.35 (1.55%) |
18.18 |
18.18 - 18.48 |
0.1721 times |
Fri 17 October 2025 |
18.07 (-1.85%) |
18.45 |
17.88 - 18.55 |
0.9833 times |
Fri 10 October 2025 |
18.41 (-3.56%) |
19.10 |
18.39 - 19.46 |
1.0526 times |
Fri 03 October 2025 |
19.09 (-2.5%) |
19.51 |
19.00 - 19.72 |
1.009 times |
Fri 26 September 2025 |
19.58 (5.5%) |
18.52 |
18.42 - 19.82 |
1.1362 times |
Fri 19 September 2025 |
18.56 (-0.32%) |
18.61 |
18.15 - 18.71 |
1.7904 times |
Fri 12 September 2025 |
18.62 (2.03%) |
18.25 |
17.95 - 18.70 |
1.4291 times |
Fri 05 September 2025 |
18.25 (2.59%) |
17.65 |
17.55 - 18.26 |
1.1002 times |
Fri 29 August 2025 |
17.79 (0%) |
17.84 |
17.69 - 17.85 |
0.2544 times |
Fri 29 August 2025 |
17.79 (0.51%) |
17.70 |
17.54 - 17.86 |
1.0728 times |
Fri 22 August 2025 |
17.70 (-1.17%) |
17.77 |
17.39 - 17.84 |
1.4639 times |
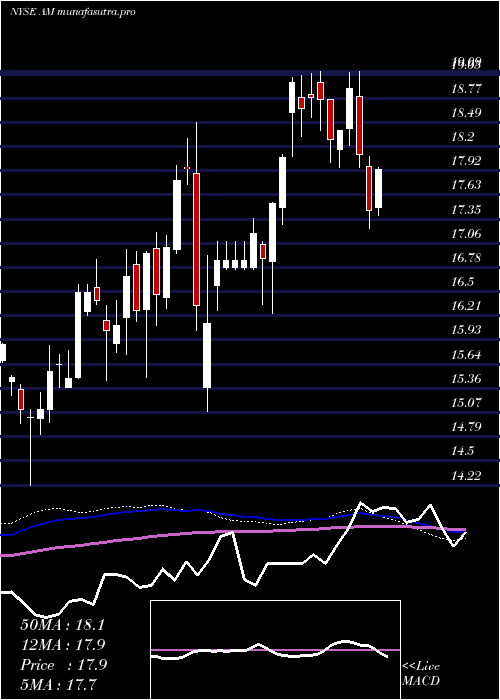
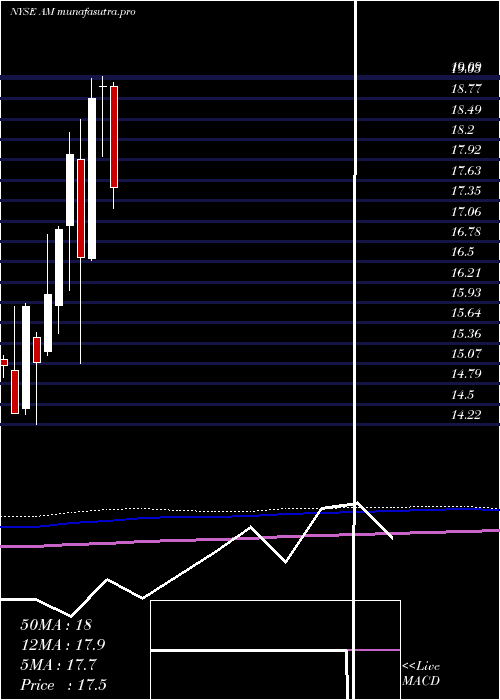
Monthly price and charts AnteroMidstream Strong monthly Stock price targets for AnteroMidstream AM are 17.2 and 19.04 | Monthly Target 1 | 16.81 | | Monthly Target 2 | 17.58 | | Monthly Target 3 | 18.65 | | Monthly Target 4 | 19.42 | | Monthly Target 5 | 20.49 |
Monthly price and volumes Antero Midstream
| Date |
Closing |
Open |
Range |
Volume |
Mon 20 October 2025 |
18.35 (-5.61%) |
19.38 |
17.88 - 19.72 |
0.4285 times |
Tue 30 September 2025 |
19.44 (9.27%) |
17.65 |
17.55 - 19.82 |
0.9079 times |
Fri 29 August 2025 |
17.79 (-3.05%) |
18.37 |
17.39 - 18.80 |
0.8892 times |
Thu 31 July 2025 |
18.35 (-3.17%) |
18.95 |
16.77 - 19.00 |
1.0888 times |
Mon 30 June 2025 |
18.95 (0.91%) |
18.95 |
17.96 - 19.09 |
0.9265 times |
Fri 30 May 2025 |
18.78 (13.47%) |
16.54 |
16.51 - 19.06 |
0.9191 times |
Wed 30 April 2025 |
16.55 (-8.06%) |
17.93 |
15.08 - 18.49 |
1.163 times |
Mon 31 March 2025 |
18.00 (6.19%) |
17.00 |
16.10 - 18.30 |
1.6176 times |
Fri 28 February 2025 |
16.95 (5.67%) |
15.88 |
15.49 - 16.99 |
1.048 times |
Fri 31 January 2025 |
16.04 (6.3%) |
15.24 |
15.18 - 16.87 |
1.0115 times |
Tue 31 December 2024 |
15.09 (-4.91%) |
15.44 |
14.22 - 15.51 |
0.7078 times |
DMA SMA EMA moving averages of Antero Midstream AM
DMA (daily moving average) of Antero Midstream AM
| DMA period | DMA value | | 5 day DMA | 18.14 | | 12 day DMA | 18.58 | | 20 day DMA | 18.91 | | 35 day DMA | 18.66 | | 50 day DMA | 18.4 | | 100 day DMA | 18.25 | | 150 day DMA | 18 | | 200 day DMA | 17.58 | EMA (exponential moving average) of Antero Midstream AM
| EMA period | EMA current | EMA prev | EMA prev2 | | 5 day EMA | 18.25 | 18.2 | 18.27 | | 12 day EMA | 18.48 | 18.5 | 18.58 | | 20 day EMA | 18.59 | 18.61 | 18.67 | | 35 day EMA | 18.55 | 18.56 | 18.59 | | 50 day EMA | 18.39 | 18.39 | 18.4 |
SMA (simple moving average) of Antero Midstream AM
| SMA period | SMA current | SMA prev | SMA prev2 | | 5 day SMA | 18.14 | 18.15 | 18.21 | | 12 day SMA | 18.58 | 18.66 | 18.77 | | 20 day SMA | 18.91 | 18.93 | 18.96 | | 35 day SMA | 18.66 | 18.64 | 18.64 | | 50 day SMA | 18.4 | 18.4 | 18.41 | | 100 day SMA | 18.25 | 18.26 | 18.27 | | 150 day SMA | 18 | 18 | 17.99 | | 200 day SMA | 17.58 | 17.57 | 17.55 |
|
|
