AlexanderS ALX full analysis,charts,indicators,moving averages,SMA,DMA,EMA,ADX,MACD,RSIAlexander S ALX WideScreen charts, DMA,SMA,EMA technical analysis, forecast prediction, by indicators ADX,MACD,RSI,CCI NYSE stock exchange
operates under Consumer Services sector & deals in Real Estate Investment Trusts
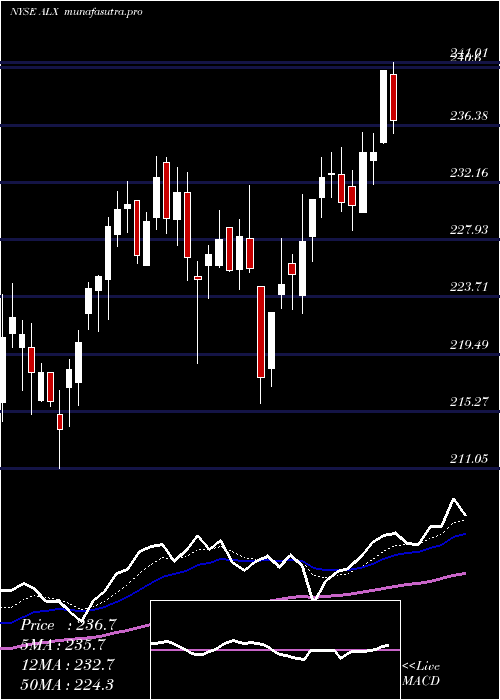
Daily price and charts and targets AlexanderS Strong Daily Stock price targets for AlexanderS ALX are 228.25 and 235.41 | Daily Target 1 | 226.94 | | Daily Target 2 | 229.56 | | Daily Target 3 | 234.09666666667 | | Daily Target 4 | 236.72 | | Daily Target 5 | 241.26 |
Daily price and volume Alexander S
| Date |
Closing |
Open |
Range |
Volume |
Tue 21 October 2025 |
232.19 (-1.82%) |
238.25 |
231.47 - 238.63 |
0.775 times |
Mon 20 October 2025 |
236.50 (0.27%) |
238.09 |
233.25 - 238.52 |
0.8036 times |
Fri 17 October 2025 |
235.87 (1.54%) |
231.48 |
229.00 - 236.03 |
0.9527 times |
Thu 16 October 2025 |
232.30 (-1.95%) |
236.46 |
231.37 - 240.84 |
1.0492 times |
Wed 15 October 2025 |
236.91 (1.69%) |
233.47 |
232.58 - 239.00 |
1.1232 times |
Tue 14 October 2025 |
232.97 (0.27%) |
232.39 |
228.05 - 233.76 |
0.8096 times |
Mon 13 October 2025 |
232.34 (1.51%) |
231.95 |
230.36 - 236.15 |
1.0874 times |
Fri 10 October 2025 |
228.88 (-4.14%) |
238.09 |
228.41 - 241.65 |
1.0886 times |
Thu 09 October 2025 |
238.77 (-0.67%) |
241.91 |
235.98 - 243.60 |
1.3974 times |
Wed 08 October 2025 |
240.37 (0.6%) |
238.63 |
237.20 - 242.06 |
0.9133 times |
Tue 07 October 2025 |
238.94 (-0.54%) |
240.13 |
237.15 - 240.78 |
1.0218 times |
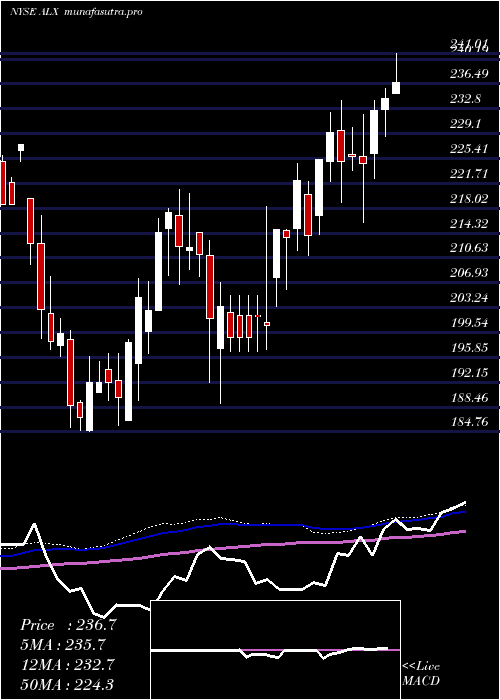
Weekly price and charts AlexanderS Strong weekly Stock price targets for AlexanderS ALX are 228.25 and 235.41 | Weekly Target 1 | 226.94 | | Weekly Target 2 | 229.56 | | Weekly Target 3 | 234.09666666667 | | Weekly Target 4 | 236.72 | | Weekly Target 5 | 241.26 |
Weekly price and volumes for Alexander S
| Date |
Closing |
Open |
Range |
Volume |
Tue 21 October 2025 |
232.19 (-1.56%) |
238.09 |
231.47 - 238.63 |
0.465 times |
Fri 17 October 2025 |
235.87 (3.05%) |
231.95 |
228.05 - 240.84 |
1.4794 times |
Fri 10 October 2025 |
228.88 (-5.98%) |
244.70 |
228.41 - 245.80 |
1.5034 times |
Fri 03 October 2025 |
243.45 (3.45%) |
234.90 |
230.65 - 245.15 |
1.25 times |
Fri 26 September 2025 |
235.32 (1.3%) |
231.47 |
230.26 - 241.86 |
1.425 times |
Fri 19 September 2025 |
232.30 (-4.87%) |
244.70 |
231.15 - 246.81 |
1.4995 times |
Fri 12 September 2025 |
244.19 (4.15%) |
235.20 |
232.45 - 247.42 |
0.8672 times |
Fri 05 September 2025 |
234.46 (1.79%) |
229.24 |
226.28 - 236.20 |
0.6336 times |
Fri 29 August 2025 |
230.34 (0%) |
230.68 |
226.89 - 232.84 |
0.0983 times |
Fri 29 August 2025 |
230.34 (0.23%) |
229.21 |
226.89 - 236.57 |
0.7784 times |
Fri 22 August 2025 |
229.81 (5.08%) |
219.09 |
218.75 - 230.34 |
0.5191 times |
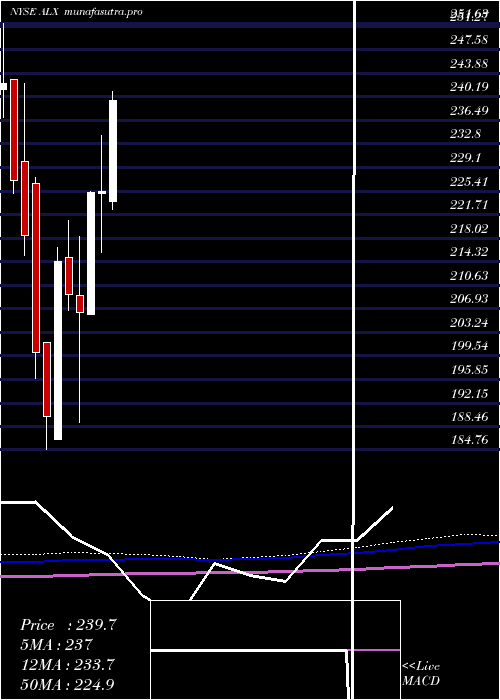
Monthly price and charts AlexanderS Strong monthly Stock price targets for AlexanderS ALX are 221.25 and 239 | Monthly Target 1 | 217.6 | | Monthly Target 2 | 224.89 | | Monthly Target 3 | 235.34666666667 | | Monthly Target 4 | 242.64 | | Monthly Target 5 | 253.1 |
Monthly price and volumes Alexander S
| Date |
Closing |
Open |
Range |
Volume |
Tue 21 October 2025 |
232.19 (-0.98%) |
234.00 |
228.05 - 245.80 |
1.4757 times |
Tue 30 September 2025 |
234.49 (1.8%) |
229.24 |
226.28 - 247.42 |
1.7989 times |
Fri 29 August 2025 |
230.34 (-8.3%) |
248.61 |
210.99 - 250.10 |
1.183 times |
Thu 31 July 2025 |
251.19 (11.48%) |
223.77 |
222.50 - 260.84 |
1.4649 times |
Mon 30 June 2025 |
225.32 (0.06%) |
225.00 |
215.83 - 234.07 |
1.8858 times |
Fri 30 May 2025 |
225.19 (9.1%) |
206.07 |
206.00 - 225.28 |
0.724 times |
Wed 30 April 2025 |
206.40 (-1.32%) |
209.00 |
189.05 - 218.26 |
0.3584 times |
Mon 31 March 2025 |
209.16 (-2.42%) |
215.00 |
206.71 - 220.85 |
0.3967 times |
Fri 28 February 2025 |
214.34 (12.84%) |
186.45 |
186.45 - 216.50 |
0.3991 times |
Fri 31 January 2025 |
189.95 (-5.05%) |
201.57 |
184.76 - 201.57 |
0.3134 times |
Tue 31 December 2024 |
200.06 (-8.44%) |
226.61 |
196.00 - 227.50 |
0.3452 times |
DMA SMA EMA moving averages of Alexander S ALX
DMA (daily moving average) of Alexander S ALX
| DMA period | DMA value | | 5 day DMA | 234.75 | | 12 day DMA | 235.52 | | 20 day DMA | 236.06 | | 35 day DMA | 236.26 | | 50 day DMA | 233.38 | | 100 day DMA | 233.67 | | 150 day DMA | 225.5 | | 200 day DMA | 219.12 | EMA (exponential moving average) of Alexander S ALX
| EMA period | EMA current | EMA prev | EMA prev2 | | 5 day EMA | 234.27 | 235.31 | 234.71 | | 12 day EMA | 235.08 | 235.6 | 235.44 | | 20 day EMA | 235.3 | 235.63 | 235.54 | | 35 day EMA | 233.98 | 234.09 | 233.95 | | 50 day EMA | 232.6 | 232.62 | 232.46 |
SMA (simple moving average) of Alexander S ALX
| SMA period | SMA current | SMA prev | SMA prev2 | | 5 day SMA | 234.75 | 234.91 | 234.08 | | 12 day SMA | 235.52 | 236.46 | 236.69 | | 20 day SMA | 236.06 | 236.46 | 236.34 | | 35 day SMA | 236.26 | 236.14 | 235.97 | | 50 day SMA | 233.38 | 233.16 | 232.75 | | 100 day SMA | 233.67 | 233.55 | 233.37 | | 150 day SMA | 225.5 | 225.35 | 225.19 | | 200 day SMA | 219.12 | 218.96 | 218.76 |
|
|
