AllisonTransmission ALSN full analysis,charts,indicators,moving averages,SMA,DMA,EMA,ADX,MACD,RSIAllison Transmission ALSN WideScreen charts, DMA,SMA,EMA technical analysis, forecast prediction, by indicators ADX,MACD,RSI,CCI NYSE stock exchange
operates under Capital Goods sector & deals in Auto Parts O E M
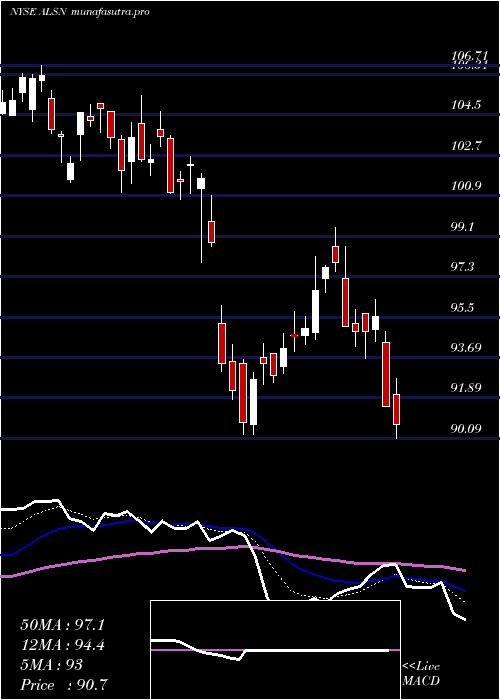
Daily price and charts and targets AllisonTransmission Strong Daily Stock price targets for AllisonTransmission ALSN are 90.99 and 94.58 | Daily Target 1 | 88.08 | | Daily Target 2 | 90.31 | | Daily Target 3 | 91.67 | | Daily Target 4 | 93.9 | | Daily Target 5 | 95.26 |
Daily price and volume Allison Transmission
| Date |
Closing |
Open |
Range |
Volume |
Fri 05 December 2025 |
92.54 (2.31%) |
90.14 |
89.44 - 93.03 |
1.2513 times |
Thu 04 December 2025 |
90.45 (-0.08%) |
90.80 |
90.07 - 91.35 |
0.5695 times |
Wed 03 December 2025 |
90.52 (1.34%) |
89.11 |
89.11 - 91.11 |
0.7007 times |
Tue 02 December 2025 |
89.32 (0%) |
89.67 |
88.88 - 89.99 |
0.8026 times |
Mon 01 December 2025 |
89.32 (0.74%) |
88.59 |
88.15 - 90.74 |
1.153 times |
Fri 28 November 2025 |
88.66 (-0.89%) |
89.43 |
88.55 - 90.00 |
0.7794 times |
Wed 26 November 2025 |
89.46 (1.84%) |
87.71 |
86.98 - 89.71 |
1.1433 times |
Tue 25 November 2025 |
87.84 (2.91%) |
86.05 |
85.02 - 88.70 |
1.1003 times |
Mon 24 November 2025 |
85.36 (1.23%) |
84.31 |
84.18 - 85.79 |
1.235 times |
Fri 21 November 2025 |
84.32 (3.78%) |
81.35 |
81.18 - 85.57 |
1.2651 times |
Thu 20 November 2025 |
81.25 (-0.05%) |
82.26 |
80.44 - 82.50 |
0.9202 times |
Weekly price and charts AllisonTransmission Strong weekly Stock price targets for AllisonTransmission ALSN are 90.35 and 95.23 | Weekly Target 1 | 86.36 | | Weekly Target 2 | 89.45 | | Weekly Target 3 | 91.24 | | Weekly Target 4 | 94.33 | | Weekly Target 5 | 96.12 |
Weekly price and volumes for Allison Transmission
| Date |
Closing |
Open |
Range |
Volume |
Fri 05 December 2025 |
92.54 (4.38%) |
88.59 |
88.15 - 93.03 |
1.1979 times |
Fri 28 November 2025 |
88.66 (5.15%) |
84.31 |
84.18 - 90.00 |
1.1393 times |
Fri 21 November 2025 |
84.32 (3.17%) |
81.64 |
78.77 - 85.57 |
1.2029 times |
Fri 14 November 2025 |
81.73 (-0.27%) |
82.66 |
80.81 - 83.83 |
1.0375 times |
Fri 07 November 2025 |
81.95 (-0.73%) |
80.52 |
78.19 - 83.00 |
1.1406 times |
Fri 31 October 2025 |
82.55 (0%) |
82.57 |
82.34 - 84.21 |
0.309 times |
Fri 31 October 2025 |
82.55 (-0.29%) |
83.40 |
76.01 - 84.86 |
1.6625 times |
Fri 24 October 2025 |
82.79 (2.36%) |
81.40 |
80.75 - 84.25 |
0.9129 times |
Fri 17 October 2025 |
80.88 (-3.36%) |
80.59 |
79.35 - 83.91 |
1.0145 times |
Tue 07 October 2025 |
83.69 (-3.21%) |
87.05 |
83.54 - 87.38 |
0.3829 times |
Fri 03 October 2025 |
86.47 (0.92%) |
86.07 |
83.91 - 87.66 |
0.9848 times |

Monthly price and charts AllisonTransmission Strong monthly Stock price targets for AllisonTransmission ALSN are 90.35 and 95.23 | Monthly Target 1 | 86.36 | | Monthly Target 2 | 89.45 | | Monthly Target 3 | 91.24 | | Monthly Target 4 | 94.33 | | Monthly Target 5 | 96.12 |
Monthly price and volumes Allison Transmission
| Date |
Closing |
Open |
Range |
Volume |
Fri 05 December 2025 |
92.54 (4.38%) |
88.59 |
88.15 - 93.03 |
0.2785 times |
Fri 28 November 2025 |
88.66 (7.4%) |
80.52 |
78.19 - 90.00 |
1.051 times |
Fri 31 October 2025 |
82.55 (-2.75%) |
84.35 |
76.01 - 87.66 |
1.1293 times |
Tue 30 September 2025 |
84.88 (-2.78%) |
85.78 |
83.91 - 91.27 |
1.1787 times |
Fri 29 August 2025 |
87.31 (-3.06%) |
88.69 |
83.73 - 91.43 |
1.2851 times |
Thu 31 July 2025 |
90.07 (-5.18%) |
94.81 |
85.58 - 99.50 |
1.1874 times |
Mon 30 June 2025 |
94.99 (-8.24%) |
103.42 |
90.28 - 105.36 |
0.9319 times |
Fri 30 May 2025 |
103.52 (12.23%) |
93.84 |
92.76 - 106.71 |
0.824 times |
Wed 30 April 2025 |
92.24 (-3.59%) |
95.33 |
80.39 - 99.27 |
1.0814 times |
Mon 31 March 2025 |
95.67 (-5.98%) |
102.23 |
92.66 - 102.72 |
1.0527 times |
Fri 28 February 2025 |
101.75 (-13.43%) |
114.61 |
94.26 - 117.07 |
0.974 times |

DMA SMA EMA moving averages of Allison Transmission ALSN
DMA (daily moving average) of Allison Transmission ALSN
| DMA period | DMA value | | 5 day DMA | 90.43 | | 12 day DMA | 87.53 | | 20 day DMA | 85.1 | | 35 day DMA | 83.79 | | 50 day DMA | 84.05 | | 100 day DMA | 86.21 | | 150 day DMA | 90.49 | | 200 day DMA | 91.57 | EMA (exponential moving average) of Allison Transmission ALSN
| EMA period | EMA current | EMA prev | EMA prev2 | | 5 day EMA | 90.53 | 89.52 | 89.06 | | 12 day EMA | 88.15 | 87.35 | 86.79 | | 20 day EMA | 86.59 | 85.96 | 85.49 | | 35 day EMA | 85.59 | 85.18 | 84.87 | | 50 day EMA | 85.04 | 84.73 | 84.5 |
SMA (simple moving average) of Allison Transmission ALSN
| SMA period | SMA current | SMA prev | SMA prev2 | | 5 day SMA | 90.43 | 89.65 | 89.46 | | 12 day SMA | 87.53 | 86.46 | 85.53 | | 20 day SMA | 85.1 | 84.55 | 84.07 | | 35 day SMA | 83.79 | 83.48 | 83.27 | | 50 day SMA | 84.05 | 83.97 | 83.92 | | 100 day SMA | 86.21 | 86.24 | 86.28 | | 150 day SMA | 90.49 | 90.49 | 90.5 | | 200 day SMA | 91.57 | 91.62 | 91.67 |
|
|
