AllstateCorp ALL-H full analysis,charts,indicators,moving averages,SMA,DMA,EMA,ADX,MACD,RSIAllstate Corp ALL-H WideScreen charts, DMA,SMA,EMA technical analysis, forecast prediction, by indicators ADX,MACD,RSI,CCI NYSE stock exchange
Daily price and charts and targets AllstateCorp Strong Daily Stock price targets for AllstateCorp ALL-H are 21.17 and 21.32 | Daily Target 1 | 21.04 | | Daily Target 2 | 21.14 | | Daily Target 3 | 21.19 | | Daily Target 4 | 21.29 | | Daily Target 5 | 21.34 |
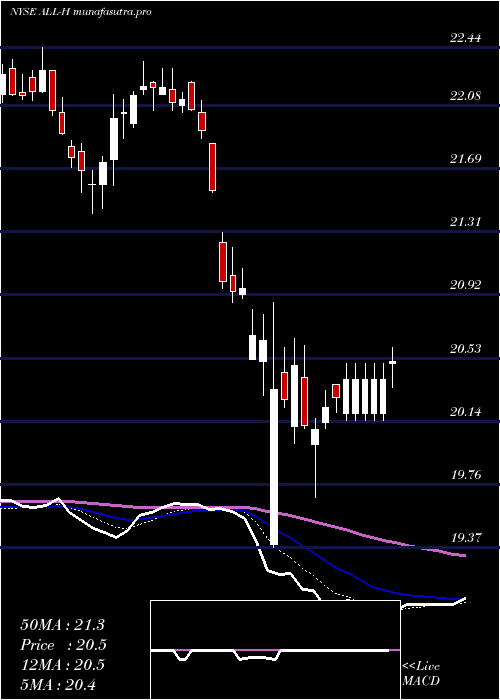
Daily price and volume Allstate Corp
| Date |
Closing |
Open |
Range |
Volume |
Thu 04 December 2025 |
21.24 (0.14%) |
21.13 |
21.09 - 21.24 |
1.2992 times |
Wed 03 December 2025 |
21.21 (0.24%) |
21.16 |
21.07 - 21.24 |
0.9616 times |
Tue 02 December 2025 |
21.16 (0.52%) |
21.12 |
20.94 - 21.16 |
1.3053 times |
Mon 01 December 2025 |
21.05 (-0.71%) |
21.14 |
21.02 - 21.27 |
0.8531 times |
Fri 28 November 2025 |
21.20 (-0.84%) |
21.31 |
21.17 - 21.39 |
0.4863 times |
Wed 26 November 2025 |
21.38 (0.66%) |
21.24 |
21.16 - 21.42 |
0.9516 times |
Tue 25 November 2025 |
21.24 (0.09%) |
21.29 |
21.13 - 21.30 |
0.8561 times |
Mon 24 November 2025 |
21.22 (0.76%) |
21.07 |
21.07 - 21.27 |
0.9506 times |
Fri 21 November 2025 |
21.06 (0.48%) |
20.96 |
20.83 - 21.16 |
0.5667 times |
Thu 20 November 2025 |
20.96 (-0.57%) |
21.12 |
20.95 - 21.22 |
1.7695 times |
Wed 19 November 2025 |
21.08 (-0.05%) |
21.01 |
20.98 - 21.11 |
1.453 times |
Weekly price and charts AllstateCorp Strong weekly Stock price targets for AllstateCorp ALL-H are 21.09 and 21.42 | Weekly Target 1 | 20.82 | | Weekly Target 2 | 21.03 | | Weekly Target 3 | 21.15 | | Weekly Target 4 | 21.36 | | Weekly Target 5 | 21.48 |
Weekly price and volumes for Allstate Corp
| Date |
Closing |
Open |
Range |
Volume |
Thu 04 December 2025 |
21.24 (0.19%) |
21.14 |
20.94 - 21.27 |
1.2798 times |
Fri 28 November 2025 |
21.20 (0.66%) |
21.07 |
21.07 - 21.42 |
0.9396 times |
Fri 21 November 2025 |
21.06 (-1.27%) |
21.32 |
20.83 - 21.34 |
1.5385 times |
Fri 14 November 2025 |
21.33 (-0.05%) |
21.38 |
21.08 - 21.58 |
1.2044 times |
Fri 07 November 2025 |
21.34 (-2.07%) |
21.64 |
21.25 - 21.78 |
0.9079 times |
Fri 31 October 2025 |
21.79 (0%) |
21.72 |
21.65 - 21.79 |
0.3605 times |
Fri 31 October 2025 |
21.79 (-1.04%) |
22.12 |
21.65 - 22.20 |
1.2786 times |
Fri 24 October 2025 |
22.02 (0.14%) |
22.07 |
22.00 - 22.36 |
0.7551 times |
Fri 17 October 2025 |
21.99 (0.64%) |
22.00 |
21.84 - 22.38 |
0.9457 times |
Fri 10 October 2025 |
21.85 (-2.15%) |
22.27 |
21.76 - 22.37 |
0.7898 times |
Fri 03 October 2025 |
22.33 (-1.59%) |
22.73 |
22.24 - 22.81 |
1.0787 times |

Monthly price and charts AllstateCorp Strong monthly Stock price targets for AllstateCorp ALL-H are 21.09 and 21.42 | Monthly Target 1 | 20.82 | | Monthly Target 2 | 21.03 | | Monthly Target 3 | 21.15 | | Monthly Target 4 | 21.36 | | Monthly Target 5 | 21.48 |
Monthly price and volumes Allstate Corp
| Date |
Closing |
Open |
Range |
Volume |
Thu 04 December 2025 |
21.24 (0.19%) |
21.14 |
20.94 - 21.27 |
0.2848 times |
Fri 28 November 2025 |
21.20 (-2.71%) |
21.64 |
20.83 - 21.78 |
1.0216 times |
Fri 31 October 2025 |
21.79 (-2.02%) |
22.27 |
21.65 - 22.50 |
1.047 times |
Tue 30 September 2025 |
22.24 (1.78%) |
21.75 |
21.75 - 23.38 |
0.8846 times |
Fri 29 August 2025 |
21.85 (1.02%) |
21.65 |
21.56 - 22.20 |
0.8516 times |
Thu 31 July 2025 |
21.63 (5%) |
20.67 |
20.55 - 21.77 |
1.0005 times |
Mon 30 June 2025 |
20.60 (-0.87%) |
20.68 |
20.50 - 21.29 |
1.1552 times |
Fri 30 May 2025 |
20.78 (0.24%) |
20.76 |
20.28 - 21.20 |
1.4263 times |
Wed 30 April 2025 |
20.73 (-1.29%) |
21.04 |
19.37 - 21.21 |
1.1094 times |
Mon 31 March 2025 |
21.00 (-5.28%) |
22.17 |
20.96 - 22.44 |
1.2189 times |
Fri 28 February 2025 |
22.17 (-1.07%) |
22.27 |
21.70 - 22.49 |
0.7372 times |

DMA SMA EMA moving averages of Allstate Corp ALL-H
DMA (daily moving average) of Allstate Corp ALL-H
| DMA period | DMA value | | 5 day DMA | 21.17 | | 12 day DMA | 21.16 | | 20 day DMA | 21.23 | | 35 day DMA | 21.53 | | 50 day DMA | 21.77 | | 100 day DMA | 21.9 | | 150 day DMA | 21.52 | | 200 day DMA | 21.47 | EMA (exponential moving average) of Allstate Corp ALL-H
| EMA period | EMA current | EMA prev | EMA prev2 | | 5 day EMA | 21.2 | 21.18 | 21.17 | | 12 day EMA | 21.22 | 21.22 | 21.22 | | 20 day EMA | 21.3 | 21.31 | 21.32 | | 35 day EMA | 21.54 | 21.56 | 21.58 | | 50 day EMA | 21.82 | 21.84 | 21.87 |
SMA (simple moving average) of Allstate Corp ALL-H
| SMA period | SMA current | SMA prev | SMA prev2 | | 5 day SMA | 21.17 | 21.2 | 21.21 | | 12 day SMA | 21.16 | 21.14 | 21.15 | | 20 day SMA | 21.23 | 21.25 | 21.26 | | 35 day SMA | 21.53 | 21.56 | 21.58 | | 50 day SMA | 21.77 | 21.8 | 21.84 | | 100 day SMA | 21.9 | 21.9 | 21.9 | | 150 day SMA | 21.52 | 21.52 | 21.52 | | 200 day SMA | 21.47 | 21.48 | 21.48 |
|
|
