AllstateCorporation ALL full analysis,charts,indicators,moving averages,SMA,DMA,EMA,ADX,MACD,RSIAllstate Corporation ALL WideScreen charts, DMA,SMA,EMA technical analysis, forecast prediction, by indicators ADX,MACD,RSI,CCI NYSE stock exchange
operates under Finance sector & deals in Property Casualty Insurers
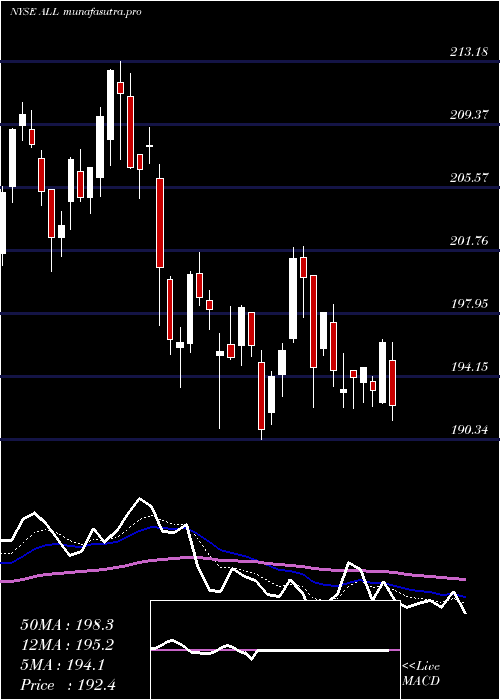
Daily price and charts and targets AllstateCorporation Strong Daily Stock price targets for AllstateCorporation ALL are 204.25 and 208.4 | Daily Target 1 | 203.54 | | Daily Target 2 | 204.95 | | Daily Target 3 | 207.68666666667 | | Daily Target 4 | 209.1 | | Daily Target 5 | 211.84 |
Daily price and volume Allstate Corporation
| Date |
Closing |
Open |
Range |
Volume |
Thu 04 December 2025 |
206.37 (-1.08%) |
208.99 |
206.27 - 210.42 |
0.879 times |
Wed 03 December 2025 |
208.62 (-0.14%) |
209.25 |
206.97 - 211.13 |
1.0918 times |
Tue 02 December 2025 |
208.91 (-0.52%) |
210.03 |
208.52 - 210.39 |
1.2497 times |
Mon 01 December 2025 |
210.00 (-1.4%) |
212.65 |
209.87 - 213.58 |
1.0147 times |
Fri 28 November 2025 |
212.98 (-0.42%) |
214.00 |
212.75 - 215.37 |
0.3727 times |
Wed 26 November 2025 |
213.87 (0.57%) |
212.60 |
212.54 - 215.03 |
0.8214 times |
Tue 25 November 2025 |
212.65 (0.13%) |
212.86 |
212.46 - 214.51 |
1.0362 times |
Mon 24 November 2025 |
212.37 (-0.91%) |
215.05 |
212.32 - 215.20 |
1.498 times |
Fri 21 November 2025 |
214.32 (1.22%) |
213.34 |
212.01 - 215.89 |
0.9767 times |
Thu 20 November 2025 |
211.74 (0.86%) |
211.81 |
210.36 - 213.05 |
1.0598 times |
Wed 19 November 2025 |
209.93 (-0.01%) |
210.50 |
208.34 - 212.57 |
1.0463 times |
Weekly price and charts AllstateCorporation Strong weekly Stock price targets for AllstateCorporation ALL are 202.67 and 209.98 | Weekly Target 1 | 201.43 | | Weekly Target 2 | 203.9 | | Weekly Target 3 | 208.74 | | Weekly Target 4 | 211.21 | | Weekly Target 5 | 216.05 |
Weekly price and volumes for Allstate Corporation
| Date |
Closing |
Open |
Range |
Volume |
Thu 04 December 2025 |
206.37 (-3.1%) |
212.65 |
206.27 - 213.58 |
1.1927 times |
Fri 28 November 2025 |
212.98 (-0.63%) |
215.05 |
212.32 - 215.37 |
1.0499 times |
Fri 21 November 2025 |
214.32 (0.01%) |
215.20 |
208.29 - 215.89 |
1.4149 times |
Fri 14 November 2025 |
214.30 (5.94%) |
200.72 |
200.38 - 215.07 |
1.2083 times |
Fri 07 November 2025 |
202.29 (5.62%) |
192.20 |
191.43 - 203.16 |
0.8704 times |
Fri 31 October 2025 |
191.52 (0%) |
191.21 |
190.08 - 192.22 |
0.2401 times |
Fri 31 October 2025 |
191.52 (-0.86%) |
193.01 |
188.08 - 193.80 |
0.998 times |
Fri 24 October 2025 |
193.19 (-1.37%) |
196.12 |
191.87 - 196.57 |
0.8461 times |
Fri 17 October 2025 |
195.87 (-4.76%) |
204.49 |
194.28 - 209.91 |
1.3337 times |
Fri 10 October 2025 |
205.67 (-2.44%) |
211.00 |
205.36 - 214.16 |
0.8459 times |
Fri 03 October 2025 |
210.82 (-0.91%) |
212.95 |
208.65 - 215.70 |
1.0411 times |
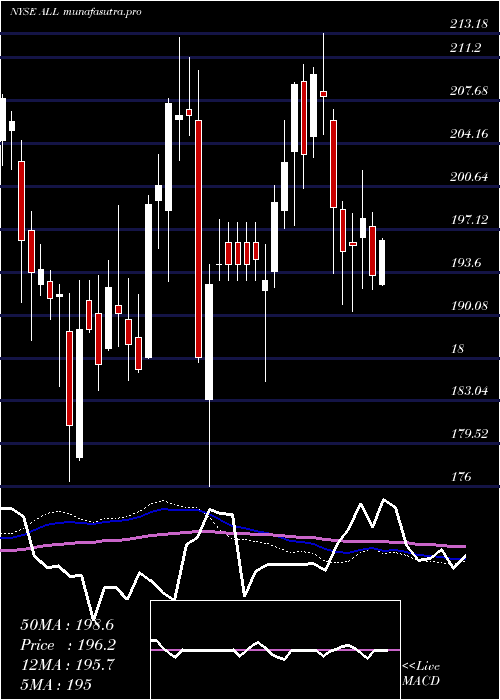
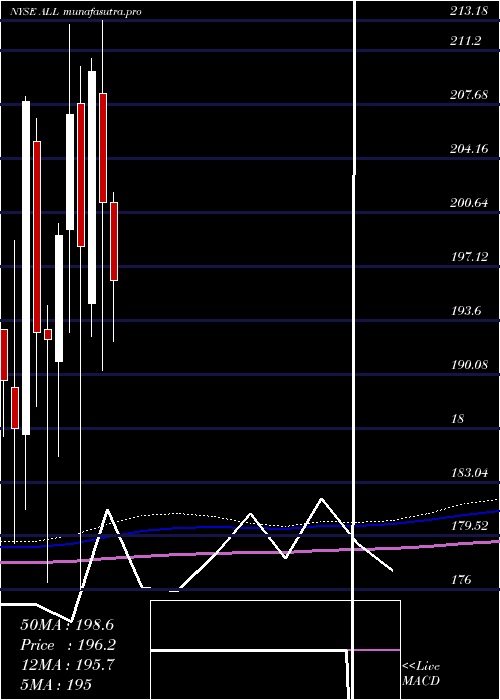
Monthly price and charts AllstateCorporation Strong monthly Stock price targets for AllstateCorporation ALL are 202.67 and 209.98 | Monthly Target 1 | 201.43 | | Monthly Target 2 | 203.9 | | Monthly Target 3 | 208.74 | | Monthly Target 4 | 211.21 | | Monthly Target 5 | 216.05 |
Monthly price and volumes Allstate Corporation
| Date |
Closing |
Open |
Range |
Volume |
Thu 04 December 2025 |
206.37 (-3.1%) |
212.65 |
206.27 - 213.58 |
0.2388 times |
Fri 28 November 2025 |
212.98 (11.21%) |
192.20 |
191.43 - 215.89 |
0.9098 times |
Fri 31 October 2025 |
191.52 (-10.78%) |
213.00 |
188.08 - 214.44 |
0.9709 times |
Tue 30 September 2025 |
214.65 (5.51%) |
204.32 |
194.78 - 215.70 |
1.0325 times |
Fri 29 August 2025 |
203.45 (0.1%) |
202.00 |
198.27 - 214.76 |
0.8872 times |
Thu 31 July 2025 |
203.25 (0.96%) |
201.32 |
189.10 - 207.09 |
1.227 times |
Mon 30 June 2025 |
201.31 (-4.08%) |
208.43 |
190.34 - 213.18 |
1.1605 times |
Fri 30 May 2025 |
209.87 (5.79%) |
194.69 |
192.52 - 210.68 |
0.9116 times |
Wed 30 April 2025 |
198.39 (-4.19%) |
207.79 |
176.00 - 210.18 |
1.2763 times |
Mon 31 March 2025 |
207.07 (3.98%) |
199.53 |
192.83 - 212.91 |
1.3854 times |
Fri 28 February 2025 |
199.15 (3.55%) |
190.88 |
184.74 - 199.94 |
1.2168 times |
DMA SMA EMA moving averages of Allstate Corporation ALL
DMA (daily moving average) of Allstate Corporation ALL
| DMA period | DMA value | | 5 day DMA | 209.38 | | 12 day DMA | 210.98 | | 20 day DMA | 209.36 | | 35 day DMA | 202.49 | | 50 day DMA | 204.61 | | 100 day DMA | 203.46 | | 150 day DMA | 202.58 | | 200 day DMA | 201.3 | EMA (exponential moving average) of Allstate Corporation ALL
| EMA period | EMA current | EMA prev | EMA prev2 | | 5 day EMA | 208.88 | 210.13 | 210.88 | | 12 day EMA | 209.42 | 209.97 | 210.22 | | 20 day EMA | 208.22 | 208.41 | 208.39 | | 35 day EMA | 207.44 | 207.5 | 207.43 | | 50 day EMA | 205.27 | 205.23 | 205.09 |
SMA (simple moving average) of Allstate Corporation ALL
| SMA period | SMA current | SMA prev | SMA prev2 | | 5 day SMA | 209.38 | 210.88 | 211.68 | | 12 day SMA | 210.98 | 211.21 | 211.69 | | 20 day SMA | 209.36 | 208.78 | 208.12 | | 35 day SMA | 202.49 | 202.32 | 202.34 | | 50 day SMA | 204.61 | 204.67 | 204.65 | | 100 day SMA | 203.46 | 203.32 | 203.19 | | 150 day SMA | 202.58 | 202.53 | 202.46 | | 200 day SMA | 201.3 | 201.23 | 201.13 |
|
|
