AlamoGroup ALG full analysis,charts,indicators,moving averages,SMA,DMA,EMA,ADX,MACD,RSIAlamo Group ALG WideScreen charts, DMA,SMA,EMA technical analysis, forecast prediction, by indicators ADX,MACD,RSI,CCI NYSE stock exchange
operates under Capital Goods sector & deals in Industrial Machinery Components
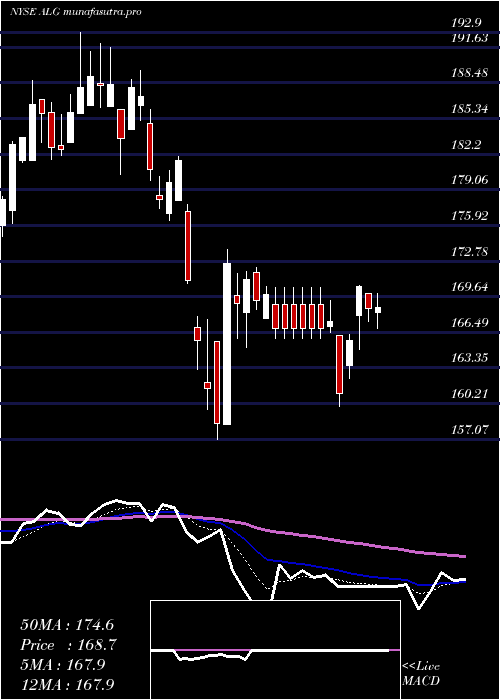
Daily price and charts and targets AlamoGroup Strong Daily Stock price targets for AlamoGroup ALG are 180.64 and 187.09 | Daily Target 1 | 175.47 | | Daily Target 2 | 179.36 | | Daily Target 3 | 181.91666666667 | | Daily Target 4 | 185.81 | | Daily Target 5 | 188.37 |
Daily price and volume Alamo Group
| Date |
Closing |
Open |
Range |
Volume |
Mon 20 October 2025 |
183.26 (1.34%) |
181.81 |
178.02 - 184.47 |
0.6747 times |
Fri 17 October 2025 |
180.83 (-1.7%) |
183.00 |
179.99 - 184.32 |
1.3965 times |
Thu 16 October 2025 |
183.95 (-0.04%) |
184.09 |
181.92 - 185.04 |
1.2333 times |
Wed 15 October 2025 |
184.03 (0.41%) |
183.86 |
183.68 - 186.72 |
1.1549 times |
Tue 14 October 2025 |
183.28 (0.71%) |
180.04 |
180.04 - 184.35 |
1.3322 times |
Mon 13 October 2025 |
181.99 (-0.31%) |
184.02 |
181.36 - 188.20 |
0.9525 times |
Fri 10 October 2025 |
182.55 (-1.58%) |
186.27 |
181.81 - 186.63 |
0.9619 times |
Thu 09 October 2025 |
185.49 (-2.1%) |
189.20 |
185.06 - 189.20 |
0.8866 times |
Wed 08 October 2025 |
189.46 (0.88%) |
188.30 |
187.27 - 190.93 |
0.6245 times |
Tue 07 October 2025 |
187.81 (-0.5%) |
188.07 |
187.81 - 189.25 |
0.783 times |
Mon 06 October 2025 |
188.75 (-1.52%) |
192.50 |
186.91 - 193.26 |
0.5377 times |
Weekly price and charts AlamoGroup Strong weekly Stock price targets for AlamoGroup ALG are 180.64 and 187.09 | Weekly Target 1 | 175.47 | | Weekly Target 2 | 179.36 | | Weekly Target 3 | 181.91666666667 | | Weekly Target 4 | 185.81 | | Weekly Target 5 | 188.37 |
Weekly price and volumes for Alamo Group
| Date |
Closing |
Open |
Range |
Volume |
Mon 20 October 2025 |
183.26 (1.34%) |
181.81 |
178.02 - 184.47 |
0.1348 times |
Fri 17 October 2025 |
180.83 (-0.94%) |
184.02 |
179.99 - 188.20 |
1.2129 times |
Fri 10 October 2025 |
182.55 (-4.75%) |
192.50 |
181.81 - 193.26 |
0.7581 times |
Fri 03 October 2025 |
191.66 (-0.5%) |
192.37 |
184.45 - 194.32 |
1.1749 times |
Fri 26 September 2025 |
192.62 (-2.94%) |
198.50 |
190.55 - 201.43 |
1.4433 times |
Fri 19 September 2025 |
198.46 (-3.49%) |
207.22 |
198.01 - 207.71 |
1.7958 times |
Fri 12 September 2025 |
205.64 (-1.71%) |
211.15 |
203.88 - 212.13 |
1.2637 times |
Fri 05 September 2025 |
209.22 (-1.06%) |
208.71 |
206.32 - 212.84 |
0.8049 times |
Fri 29 August 2025 |
211.46 (0%) |
214.75 |
209.39 - 214.75 |
0.3064 times |
Fri 29 August 2025 |
211.46 (-4.54%) |
220.86 |
209.39 - 221.68 |
1.1053 times |
Fri 22 August 2025 |
221.52 (-0.34%) |
220.61 |
210.49 - 227.07 |
1.0689 times |
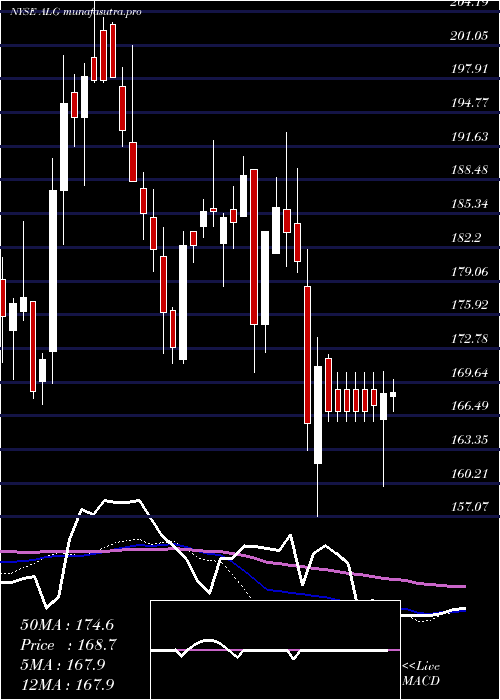
Monthly price and charts AlamoGroup Strong monthly Stock price targets for AlamoGroup ALG are 172.49 and 188.79 | Monthly Target 1 | 168.9 | | Monthly Target 2 | 176.08 | | Monthly Target 3 | 185.2 | | Monthly Target 4 | 192.38 | | Monthly Target 5 | 201.5 |
Monthly price and volumes Alamo Group
| Date |
Closing |
Open |
Range |
Volume |
Mon 20 October 2025 |
183.26 (-4%) |
190.82 |
178.02 - 194.32 |
0.4336 times |
Tue 30 September 2025 |
190.90 (-9.72%) |
208.71 |
189.18 - 212.84 |
0.8938 times |
Fri 29 August 2025 |
211.46 (-5%) |
220.90 |
209.39 - 233.29 |
0.8436 times |
Thu 31 July 2025 |
222.58 (1.92%) |
218.35 |
212.90 - 230.16 |
0.9665 times |
Mon 30 June 2025 |
218.38 (10.27%) |
196.89 |
195.41 - 220.00 |
1.4635 times |
Fri 30 May 2025 |
198.04 (18.6%) |
165.87 |
165.87 - 204.67 |
0.8966 times |
Wed 30 April 2025 |
166.98 (-6.3%) |
176.93 |
157.07 - 182.01 |
1.0093 times |
Mon 31 March 2025 |
178.21 (1.85%) |
175.00 |
172.40 - 192.90 |
1.462 times |
Fri 28 February 2025 |
174.98 (-5.7%) |
182.57 |
170.57 - 190.70 |
0.9343 times |
Fri 31 January 2025 |
185.56 (-0.19%) |
186.75 |
171.36 - 192.17 |
1.0969 times |
Tue 31 December 2024 |
185.91 (-5.99%) |
203.01 |
182.28 - 203.14 |
0.8174 times |

DMA SMA EMA moving averages of Alamo Group ALG
DMA (daily moving average) of Alamo Group ALG
| DMA period | DMA value | | 5 day DMA | 183.07 | | 12 day DMA | 185.26 | | 20 day DMA | 188.05 | | 35 day DMA | 195.77 | | 50 day DMA | 202.92 | | 100 day DMA | 209.65 | | 150 day DMA | 199.42 | | 200 day DMA | 195.41 | EMA (exponential moving average) of Alamo Group ALG
| EMA period | EMA current | EMA prev | EMA prev2 | | 5 day EMA | 183.11 | 183.04 | 184.14 | | 12 day EMA | 185.43 | 185.82 | 186.73 | | 20 day EMA | 188.84 | 189.43 | 190.33 | | 35 day EMA | 195.5 | 196.22 | 197.13 | | 50 day EMA | 202.63 | 203.42 | 204.34 |
SMA (simple moving average) of Alamo Group ALG
| SMA period | SMA current | SMA prev | SMA prev2 | | 5 day SMA | 183.07 | 182.82 | 183.16 | | 12 day SMA | 185.26 | 185.95 | 186.64 | | 20 day SMA | 188.05 | 188.77 | 189.65 | | 35 day SMA | 195.77 | 196.57 | 197.45 | | 50 day SMA | 202.92 | 203.69 | 204.52 | | 100 day SMA | 209.65 | 209.84 | 210 | | 150 day SMA | 199.42 | 199.46 | 199.51 | | 200 day SMA | 195.41 | 195.39 | 195.39 |
|
|
