AlbemarleCorporation ALB full analysis,charts,indicators,moving averages,SMA,DMA,EMA,ADX,MACD,RSIAlbemarle Corporation ALB WideScreen charts, DMA,SMA,EMA technical analysis, forecast prediction, by indicators ADX,MACD,RSI,CCI NYSE stock exchange
operates under Basic Industries sector & deals in Major Chemicals
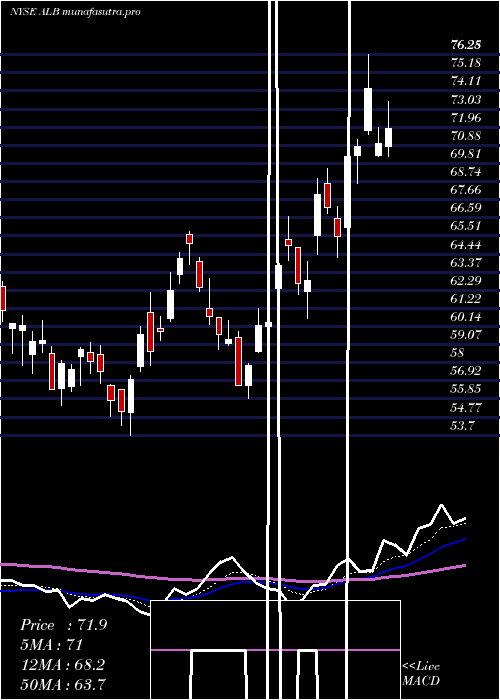
Daily price and charts and targets AlbemarleCorporation Strong Daily Stock price targets for AlbemarleCorporation ALB are 123.36 and 131.7 | Daily Target 1 | 117.19 | | Daily Target 2 | 121.19 | | Daily Target 3 | 125.53333333333 | | Daily Target 4 | 129.53 | | Daily Target 5 | 133.87 |
Daily price and volume Albemarle Corporation
| Date |
Closing |
Open |
Range |
Volume |
Fri 05 December 2025 |
125.18 (5.1%) |
122.50 |
121.54 - 129.88 |
0.8811 times |
Thu 04 December 2025 |
119.10 (-5.84%) |
125.87 |
117.61 - 127.00 |
0.8342 times |
Wed 03 December 2025 |
126.49 (-1.29%) |
124.50 |
123.43 - 127.05 |
1.52 times |
Tue 02 December 2025 |
128.14 (-0.15%) |
130.26 |
127.14 - 130.26 |
0.747 times |
Mon 01 December 2025 |
128.33 (-1.28%) |
128.47 |
128.11 - 132.90 |
1.4729 times |
Fri 28 November 2025 |
129.99 (2.47%) |
127.79 |
126.50 - 130.56 |
0.4713 times |
Wed 26 November 2025 |
126.86 (1.25%) |
125.25 |
122.13 - 127.70 |
0.4956 times |
Tue 25 November 2025 |
125.30 (8.13%) |
117.86 |
116.75 - 125.78 |
0.7533 times |
Mon 24 November 2025 |
115.88 (-0.8%) |
114.48 |
113.51 - 116.76 |
1.043 times |
Fri 21 November 2025 |
116.82 (0.34%) |
113.07 |
110.58 - 119.32 |
1.7816 times |
Thu 20 November 2025 |
116.42 (-7.37%) |
121.08 |
115.68 - 125.85 |
2.0841 times |
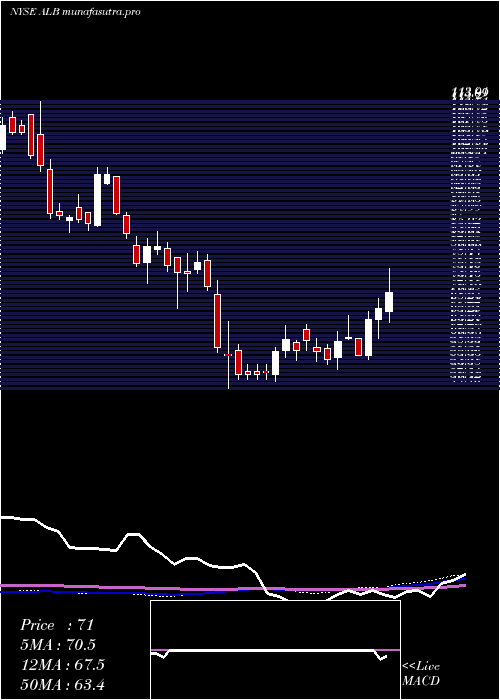
Weekly price and charts AlbemarleCorporation Strong weekly Stock price targets for AlbemarleCorporation ALB are 113.75 and 129.04 | Weekly Target 1 | 109.94 | | Weekly Target 2 | 117.56 | | Weekly Target 3 | 125.23 | | Weekly Target 4 | 132.85 | | Weekly Target 5 | 140.52 |
Weekly price and volumes for Albemarle Corporation
| Date |
Closing |
Open |
Range |
Volume |
Fri 05 December 2025 |
125.18 (-3.7%) |
128.47 |
117.61 - 132.90 |
1.094 times |
Fri 28 November 2025 |
129.99 (11.27%) |
114.48 |
113.51 - 130.56 |
0.5541 times |
Fri 21 November 2025 |
116.82 (1.46%) |
120.01 |
110.58 - 127.07 |
1.7669 times |
Fri 14 November 2025 |
115.14 (18.47%) |
101.42 |
100.00 - 119.28 |
1.3033 times |
Fri 07 November 2025 |
97.19 (-1.06%) |
93.97 |
88.01 - 98.42 |
0.6841 times |
Fri 31 October 2025 |
98.23 (0%) |
96.90 |
96.50 - 99.97 |
0.2958 times |
Fri 31 October 2025 |
98.23 (-7.03%) |
103.77 |
94.77 - 105.47 |
1.1229 times |
Fri 24 October 2025 |
105.66 (13.93%) |
94.40 |
88.76 - 106.96 |
0.7377 times |
Fri 17 October 2025 |
92.74 (3.2%) |
92.03 |
91.00 - 99.49 |
1.1979 times |
Fri 10 October 2025 |
89.86 (2.57%) |
89.75 |
88.13 - 99.86 |
1.2432 times |
Fri 03 October 2025 |
87.61 (-0.56%) |
90.58 |
79.30 - 91.31 |
1.1789 times |
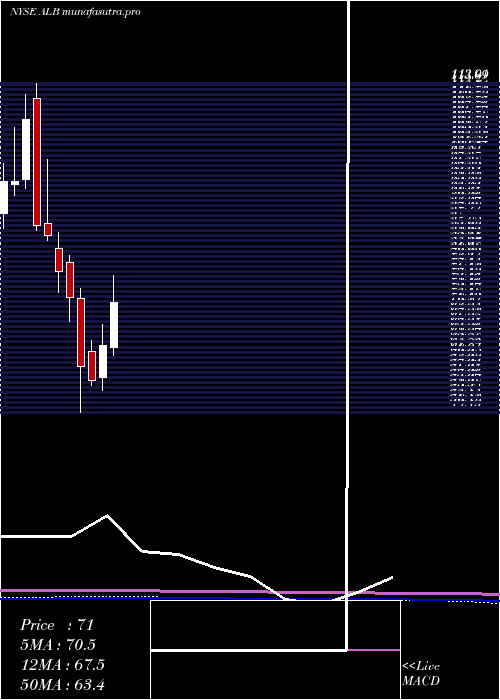
Monthly price and charts AlbemarleCorporation Strong monthly Stock price targets for AlbemarleCorporation ALB are 113.75 and 129.04 | Monthly Target 1 | 109.94 | | Monthly Target 2 | 117.56 | | Monthly Target 3 | 125.23 | | Monthly Target 4 | 132.85 | | Monthly Target 5 | 140.52 |
Monthly price and volumes Albemarle Corporation
| Date |
Closing |
Open |
Range |
Volume |
Fri 05 December 2025 |
125.18 (-3.7%) |
128.47 |
117.61 - 132.90 |
0.2124 times |
Fri 28 November 2025 |
129.99 (32.33%) |
93.97 |
88.01 - 130.56 |
0.8364 times |
Fri 31 October 2025 |
98.23 (21.15%) |
81.97 |
81.97 - 106.96 |
0.9968 times |
Tue 30 September 2025 |
81.08 (-4.52%) |
81.99 |
71.25 - 91.31 |
1.1937 times |
Fri 29 August 2025 |
84.92 (25.16%) |
66.81 |
64.95 - 87.97 |
1.2092 times |
Thu 31 July 2025 |
67.85 (8.27%) |
62.25 |
60.64 - 86.19 |
1.6725 times |
Mon 30 June 2025 |
62.67 (12.39%) |
56.40 |
53.70 - 66.67 |
0.916 times |
Fri 30 May 2025 |
55.76 (-4.77%) |
61.37 |
54.81 - 63.64 |
1.0589 times |
Wed 30 April 2025 |
58.55 (-18.7%) |
71.73 |
49.43 - 73.64 |
1.166 times |
Mon 31 March 2025 |
72.02 (-6.5%) |
78.77 |
67.23 - 80.15 |
0.7381 times |
Fri 28 February 2025 |
77.03 (-8.5%) |
81.51 |
72.88 - 84.73 |
0.7719 times |
DMA SMA EMA moving averages of Albemarle Corporation ALB
DMA (daily moving average) of Albemarle Corporation ALB
| DMA period | DMA value | | 5 day DMA | 125.45 | | 12 day DMA | 123.68 | | 20 day DMA | 118.4 | | 35 day DMA | 108.54 | | 50 day DMA | 103.22 | | 100 day DMA | 90.96 | | 150 day DMA | 81.21 | | 200 day DMA | 77.75 | EMA (exponential moving average) of Albemarle Corporation ALB
| EMA period | EMA current | EMA prev | EMA prev2 | | 5 day EMA | 124.47 | 124.11 | 126.62 | | 12 day EMA | 122.29 | 121.77 | 122.25 | | 20 day EMA | 118.09 | 117.34 | 117.16 | | 35 day EMA | 111.34 | 110.53 | 110.03 | | 50 day EMA | 103.65 | 102.77 | 102.1 |
SMA (simple moving average) of Albemarle Corporation ALB
| SMA period | SMA current | SMA prev | SMA prev2 | | 5 day SMA | 125.45 | 126.41 | 127.96 | | 12 day SMA | 123.68 | 123.36 | 123.25 | | 20 day SMA | 118.4 | 116.7 | 115.34 | | 35 day SMA | 108.54 | 107.66 | 107.06 | | 50 day SMA | 103.22 | 102.42 | 101.67 | | 100 day SMA | 90.96 | 90.41 | 89.92 | | 150 day SMA | 81.21 | 80.77 | 80.37 | | 200 day SMA | 77.75 | 77.54 | 77.36 |
|
|
