AirLease AL full analysis,charts,indicators,moving averages,SMA,DMA,EMA,ADX,MACD,RSIAir Lease AL WideScreen charts, DMA,SMA,EMA technical analysis, forecast prediction, by indicators ADX,MACD,RSI,CCI NYSE stock exchange
operates under Technology sector & deals in Diversified Commercial Services
Daily price and charts and targets AirLease Strong Daily Stock price targets for AirLease AL are 63.56 and 63.67 | Daily Target 1 | 63.53 | | Daily Target 2 | 63.59 | | Daily Target 3 | 63.64 | | Daily Target 4 | 63.7 | | Daily Target 5 | 63.75 |
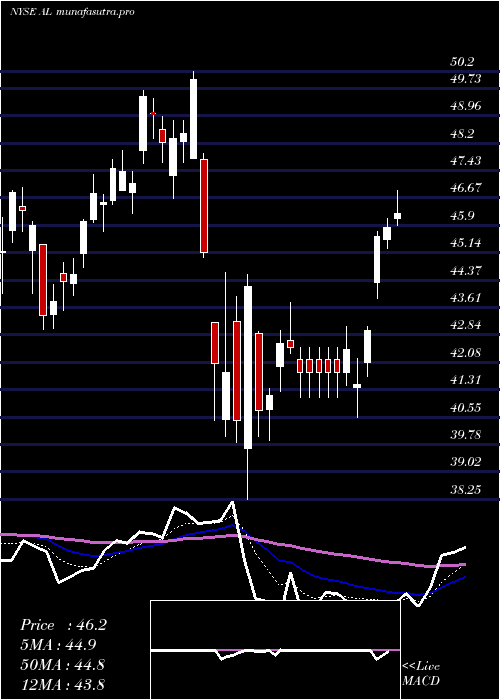
Daily price and volume Air Lease
| Date |
Closing |
Open |
Range |
Volume |
Mon 20 October 2025 |
63.65 (-0.02%) |
63.67 |
63.58 - 63.69 |
0.6857 times |
Fri 17 October 2025 |
63.66 (0.17%) |
63.60 |
63.53 - 63.70 |
1.1931 times |
Thu 16 October 2025 |
63.55 (0.08%) |
63.61 |
63.52 - 63.65 |
1.9063 times |
Wed 15 October 2025 |
63.50 (-0.16%) |
63.61 |
63.50 - 63.70 |
0.8116 times |
Tue 14 October 2025 |
63.60 (0.16%) |
63.52 |
63.51 - 63.68 |
1.1349 times |
Mon 13 October 2025 |
63.50 (0%) |
63.67 |
63.50 - 63.80 |
0.851 times |
Fri 10 October 2025 |
63.50 (-0.16%) |
63.65 |
63.44 - 63.65 |
1.443 times |
Thu 09 October 2025 |
63.60 (-0.05%) |
63.65 |
63.58 - 63.65 |
0.7339 times |
Wed 08 October 2025 |
63.63 (-0.05%) |
63.66 |
63.60 - 63.69 |
0.6456 times |
Tue 07 October 2025 |
63.66 (-0.05%) |
63.74 |
63.63 - 63.74 |
0.5948 times |
Mon 06 October 2025 |
63.69 (-0.06%) |
63.70 |
63.62 - 63.77 |
1.1562 times |
Weekly price and charts AirLease Strong weekly Stock price targets for AirLease AL are 63.56 and 63.67 | Weekly Target 1 | 63.53 | | Weekly Target 2 | 63.59 | | Weekly Target 3 | 63.64 | | Weekly Target 4 | 63.7 | | Weekly Target 5 | 63.75 |
Weekly price and volumes for Air Lease
| Date |
Closing |
Open |
Range |
Volume |
Mon 20 October 2025 |
63.65 (-0.02%) |
63.67 |
63.58 - 63.69 |
0.1502 times |
Fri 17 October 2025 |
63.66 (0.25%) |
63.67 |
63.50 - 63.80 |
1.2914 times |
Fri 10 October 2025 |
63.50 (-0.36%) |
63.70 |
63.44 - 63.77 |
1.0015 times |
Fri 03 October 2025 |
63.73 (0.35%) |
63.56 |
63.48 - 63.75 |
0.8636 times |
Fri 26 September 2025 |
63.51 (-0.16%) |
63.59 |
63.49 - 64.00 |
0.8524 times |
Fri 19 September 2025 |
63.61 (0.14%) |
63.53 |
63.38 - 63.70 |
1.5952 times |
Fri 12 September 2025 |
63.52 (-0.28%) |
63.70 |
63.49 - 63.81 |
1.39 times |
Fri 05 September 2025 |
63.70 (5.8%) |
64.02 |
63.56 - 64.30 |
2.5072 times |
Fri 29 August 2025 |
60.21 (0%) |
60.63 |
59.88 - 60.78 |
0.0515 times |
Fri 29 August 2025 |
60.21 (0.28%) |
60.11 |
59.62 - 61.10 |
0.297 times |
Fri 22 August 2025 |
60.04 (4.86%) |
57.15 |
57.01 - 60.59 |
0.2934 times |
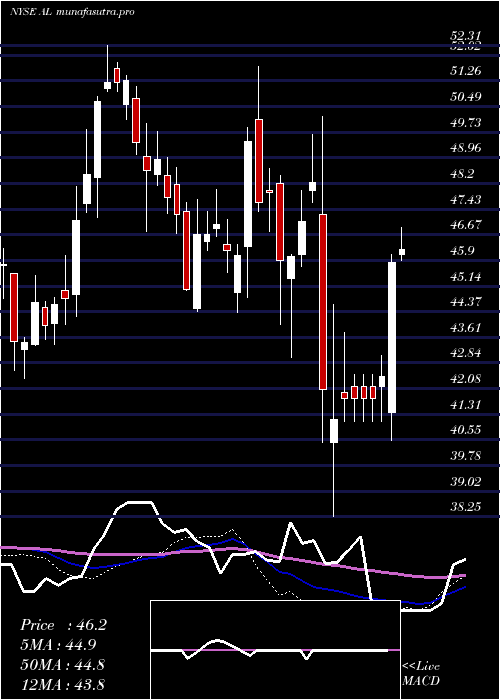
Monthly price and charts AirLease Strong monthly Stock price targets for AirLease AL are 63.55 and 63.91 | Monthly Target 1 | 63.27 | | Monthly Target 2 | 63.46 | | Monthly Target 3 | 63.63 | | Monthly Target 4 | 63.82 | | Monthly Target 5 | 63.99 |
Monthly price and volumes Air Lease
| Date |
Closing |
Open |
Range |
Volume |
Mon 20 October 2025 |
63.65 (0%) |
63.59 |
63.44 - 63.80 |
1.3351 times |
Tue 30 September 2025 |
63.65 (5.71%) |
64.02 |
63.38 - 64.30 |
3.0328 times |
Fri 29 August 2025 |
60.21 (8.68%) |
54.29 |
51.66 - 61.10 |
0.663 times |
Thu 31 July 2025 |
55.40 (-5.28%) |
58.33 |
55.27 - 60.41 |
0.6418 times |
Mon 30 June 2025 |
58.49 (1.53%) |
57.44 |
55.13 - 58.95 |
0.5782 times |
Fri 30 May 2025 |
57.61 (23.2%) |
46.96 |
46.63 - 59.27 |
1.0169 times |
Wed 30 April 2025 |
46.76 (-3.21%) |
48.25 |
38.25 - 50.20 |
0.9769 times |
Mon 31 March 2025 |
48.31 (0.81%) |
48.19 |
43.00 - 49.67 |
0.6213 times |
Fri 28 February 2025 |
47.92 (3.72%) |
44.94 |
44.34 - 51.69 |
0.5546 times |
Fri 31 January 2025 |
46.20 (-4.17%) |
48.60 |
44.37 - 48.97 |
0.5794 times |
Tue 31 December 2024 |
48.21 (-5.88%) |
50.56 |
46.77 - 51.42 |
0.4177 times |

DMA SMA EMA moving averages of Air Lease AL
DMA (daily moving average) of Air Lease AL
| DMA period | DMA value | | 5 day DMA | 63.59 | | 12 day DMA | 63.61 | | 20 day DMA | 63.6 | | 35 day DMA | 63.62 | | 50 day DMA | 62.26 | | 100 day DMA | 59.81 | | 150 day DMA | 55.97 | | 200 day DMA | 53.63 | EMA (exponential moving average) of Air Lease AL
| EMA period | EMA current | EMA prev | EMA prev2 | | 5 day EMA | 63.61 | 63.59 | 63.55 | | 12 day EMA | 63.59 | 63.58 | 63.56 | | 20 day EMA | 63.44 | 63.42 | 63.39 | | 35 day EMA | 62.6 | 62.54 | 62.47 | | 50 day EMA | 61.81 | 61.74 | 61.66 |
SMA (simple moving average) of Air Lease AL
| SMA period | SMA current | SMA prev | SMA prev2 | | 5 day SMA | 63.59 | 63.56 | 63.53 | | 12 day SMA | 63.61 | 63.6 | 63.6 | | 20 day SMA | 63.6 | 63.59 | 63.59 | | 35 day SMA | 63.62 | 63.52 | 63.42 | | 50 day SMA | 62.26 | 62.09 | 61.93 | | 100 day SMA | 59.81 | 59.75 | 59.68 | | 150 day SMA | 55.97 | 55.86 | 55.74 | | 200 day SMA | 53.63 | 53.55 | 53.48 |
|
|
