ArthurJ AJG full analysis,charts,indicators,moving averages,SMA,DMA,EMA,ADX,MACD,RSIArthur J AJG WideScreen charts, DMA,SMA,EMA technical analysis, forecast prediction, by indicators ADX,MACD,RSI,CCI NYSE stock exchange
operates under Finance sector & deals in Specialty Insurers
Daily price and charts and targets ArthurJ Strong Daily Stock price targets for ArthurJ AJG are 236.01 and 242.36 | Daily Target 1 | 234.77 | | Daily Target 2 | 237.24 | | Daily Target 3 | 241.12 | | Daily Target 4 | 243.59 | | Daily Target 5 | 247.47 |
Daily price and volume Arthur J
| Date |
Closing |
Open |
Range |
Volume |
Fri 05 December 2025 |
239.71 (-2.32%) |
244.69 |
238.65 - 245.00 |
1.246 times |
Thu 04 December 2025 |
245.41 (0.02%) |
245.77 |
243.87 - 246.89 |
0.9011 times |
Wed 03 December 2025 |
245.36 (0.47%) |
244.43 |
242.61 - 246.23 |
1.0682 times |
Tue 02 December 2025 |
244.22 (-0.76%) |
245.88 |
243.37 - 246.74 |
1.1896 times |
Mon 01 December 2025 |
246.10 (-0.61%) |
248.40 |
246.07 - 249.47 |
0.9973 times |
Fri 28 November 2025 |
247.62 (-0.36%) |
247.74 |
246.60 - 249.99 |
0.532 times |
Wed 26 November 2025 |
248.52 (-0.69%) |
250.57 |
247.80 - 252.00 |
0.7109 times |
Tue 25 November 2025 |
250.24 (0.82%) |
249.80 |
247.70 - 251.59 |
0.6794 times |
Mon 24 November 2025 |
248.21 (-1.27%) |
251.26 |
244.72 - 252.44 |
1.4728 times |
Fri 21 November 2025 |
251.41 (1.66%) |
249.00 |
246.85 - 251.65 |
1.2025 times |
Thu 20 November 2025 |
247.30 (-0.57%) |
245.74 |
245.69 - 250.43 |
1.1048 times |
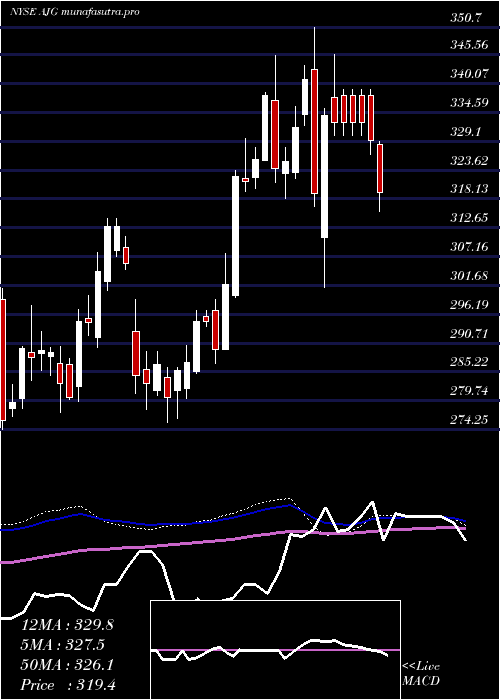
Weekly price and charts ArthurJ Strong weekly Stock price targets for ArthurJ AJG are 233.77 and 244.59 | Weekly Target 1 | 231.79 | | Weekly Target 2 | 235.75 | | Weekly Target 3 | 242.61 | | Weekly Target 4 | 246.57 | | Weekly Target 5 | 253.43 |
Weekly price and volumes for Arthur J
| Date |
Closing |
Open |
Range |
Volume |
Fri 05 December 2025 |
239.71 (-3.19%) |
248.40 |
238.65 - 249.47 |
1.0061 times |
Fri 28 November 2025 |
247.62 (-1.51%) |
251.26 |
244.72 - 252.44 |
0.6323 times |
Fri 21 November 2025 |
251.41 (-2.75%) |
259.41 |
245.69 - 261.63 |
1.2391 times |
Fri 14 November 2025 |
258.51 (3.4%) |
248.88 |
247.03 - 262.59 |
1.0556 times |
Fri 07 November 2025 |
250.01 (0.21%) |
244.50 |
242.70 - 253.00 |
0.9625 times |
Fri 31 October 2025 |
249.49 (0%) |
242.75 |
242.75 - 254.43 |
0.6635 times |
Fri 31 October 2025 |
249.49 (-11.13%) |
280.56 |
242.75 - 281.66 |
1.9267 times |
Fri 24 October 2025 |
280.73 (0.09%) |
280.22 |
275.73 - 284.33 |
0.8545 times |
Fri 17 October 2025 |
280.47 (-7.05%) |
299.05 |
276.50 - 304.57 |
1.1336 times |
Fri 10 October 2025 |
301.74 (-2.81%) |
310.50 |
300.66 - 313.09 |
0.5262 times |
Fri 03 October 2025 |
310.48 (2.08%) |
303.15 |
301.10 - 313.55 |
0.821 times |
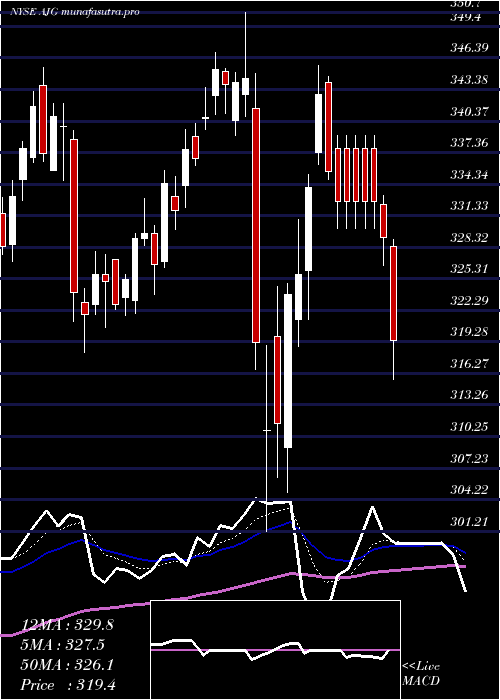
Monthly price and charts ArthurJ Strong monthly Stock price targets for ArthurJ AJG are 233.77 and 244.59 | Monthly Target 1 | 231.79 | | Monthly Target 2 | 235.75 | | Monthly Target 3 | 242.61 | | Monthly Target 4 | 246.57 | | Monthly Target 5 | 253.43 |
Monthly price and volumes Arthur J
| Date |
Closing |
Open |
Range |
Volume |
Fri 05 December 2025 |
239.71 (-3.19%) |
248.40 |
238.65 - 249.47 |
0.2648 times |
Fri 28 November 2025 |
247.62 (-0.75%) |
244.50 |
242.70 - 262.59 |
1.0235 times |
Fri 31 October 2025 |
249.49 (-19.45%) |
307.87 |
242.75 - 313.55 |
1.455 times |
Tue 30 September 2025 |
309.74 (2.31%) |
303.17 |
285.80 - 310.49 |
1.0279 times |
Fri 29 August 2025 |
302.75 (5.4%) |
285.00 |
277.53 - 307.38 |
1.1052 times |
Thu 31 July 2025 |
287.25 (-10.27%) |
320.12 |
281.83 - 323.25 |
1.034 times |
Mon 30 June 2025 |
320.12 (-7.86%) |
343.42 |
308.98 - 351.23 |
1.0251 times |
Fri 30 May 2025 |
347.44 (8.34%) |
317.59 |
313.41 - 348.30 |
0.8401 times |
Wed 30 April 2025 |
320.69 (-7.11%) |
345.07 |
301.21 - 350.70 |
1.1221 times |
Mon 31 March 2025 |
345.24 (2.22%) |
336.87 |
318.24 - 346.95 |
1.1023 times |
Fri 28 February 2025 |
337.74 (11.9%) |
299.75 |
299.37 - 338.43 |
0.9541 times |

DMA SMA EMA moving averages of Arthur J AJG
DMA (daily moving average) of Arthur J AJG
| DMA period | DMA value | | 5 day DMA | 244.16 | | 12 day DMA | 246.9 | | 20 day DMA | 250.4 | | 35 day DMA | 257.36 | | 50 day DMA | 271.2 | | 100 day DMA | 284.95 | | 150 day DMA | 299.07 | | 200 day DMA | 306.87 | EMA (exponential moving average) of Arthur J AJG
| EMA period | EMA current | EMA prev | EMA prev2 | | 5 day EMA | 243.92 | 246.02 | 246.33 | | 12 day EMA | 247.16 | 248.51 | 249.07 | | 20 day EMA | 251.06 | 252.25 | 252.97 | | 35 day EMA | 261.3 | 262.57 | 263.58 | | 50 day EMA | 271.04 | 272.32 | 273.42 |
SMA (simple moving average) of Arthur J AJG
| SMA period | SMA current | SMA prev | SMA prev2 | | 5 day SMA | 244.16 | 245.74 | 246.36 | | 12 day SMA | 246.9 | 248.48 | 249.64 | | 20 day SMA | 250.4 | 250.67 | 250.8 | | 35 day SMA | 257.36 | 258.51 | 259.96 | | 50 day SMA | 271.2 | 272.47 | 273.65 | | 100 day SMA | 284.95 | 285.66 | 286.28 | | 150 day SMA | 299.07 | 299.59 | 300.09 | | 200 day SMA | 306.87 | 307.3 | 307.71 |
|
|
