AspenInsurance AHL-D full analysis,charts,indicators,moving averages,SMA,DMA,EMA,ADX,MACD,RSIAspen Insurance AHL-D WideScreen charts, DMA,SMA,EMA technical analysis, forecast prediction, by indicators ADX,MACD,RSI,CCI NYSE stock exchange
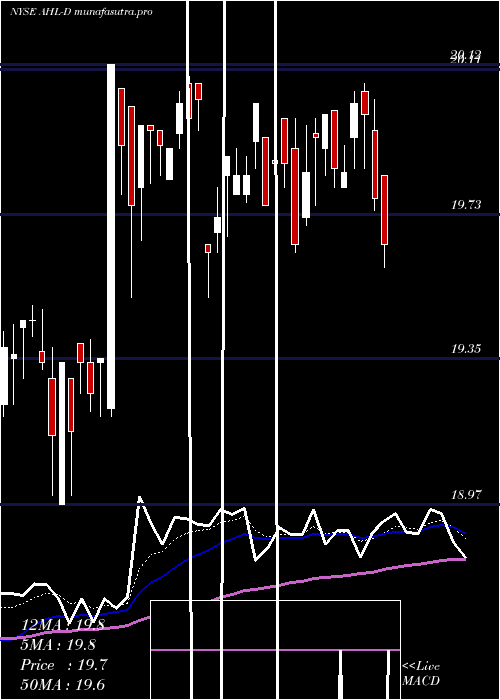
Daily price and charts and targets AspenInsurance Strong Daily Stock price targets for AspenInsurance AHL-D are 20.04 and 20.26 | Daily Target 1 | 19.99 | | Daily Target 2 | 20.09 | | Daily Target 3 | 20.21 | | Daily Target 4 | 20.31 | | Daily Target 5 | 20.43 |
Daily price and volume Aspen Insurance
| Date |
Closing |
Open |
Range |
Volume |
Thu 04 December 2025 |
20.19 (-0.49%) |
20.27 |
20.11 - 20.33 |
1.3175 times |
Wed 03 December 2025 |
20.29 (-0.05%) |
20.21 |
20.21 - 20.35 |
0.7032 times |
Tue 02 December 2025 |
20.30 (-0.25%) |
20.36 |
20.14 - 20.36 |
1.1991 times |
Mon 01 December 2025 |
20.35 (-0.93%) |
20.62 |
20.22 - 20.62 |
0.6884 times |
Fri 28 November 2025 |
20.54 (1.43%) |
20.54 |
20.33 - 20.66 |
1.4878 times |
Wed 26 November 2025 |
20.25 (-0.49%) |
20.25 |
20.20 - 20.37 |
0.607 times |
Tue 25 November 2025 |
20.35 (0.99%) |
20.30 |
20.13 - 20.40 |
0.7476 times |
Mon 24 November 2025 |
20.15 (0.6%) |
20.00 |
20.00 - 20.16 |
0.7328 times |
Fri 21 November 2025 |
20.03 (0.2%) |
19.87 |
19.84 - 20.05 |
0.7772 times |
Thu 20 November 2025 |
19.99 (-0.6%) |
20.11 |
19.98 - 20.25 |
1.7395 times |
Wed 19 November 2025 |
20.11 (-0.2%) |
20.15 |
20.04 - 20.20 |
0.6958 times |
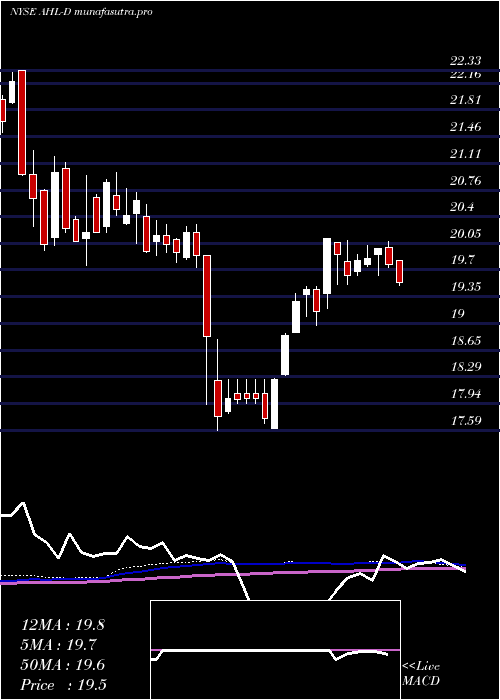
Weekly price and charts AspenInsurance Strong weekly Stock price targets for AspenInsurance AHL-D are 19.9 and 20.41 | Weekly Target 1 | 19.8 | | Weekly Target 2 | 19.99 | | Weekly Target 3 | 20.306666666667 | | Weekly Target 4 | 20.5 | | Weekly Target 5 | 20.82 |
Weekly price and volumes for Aspen Insurance
| Date |
Closing |
Open |
Range |
Volume |
Thu 04 December 2025 |
20.19 (-1.7%) |
20.62 |
20.11 - 20.62 |
1.1236 times |
Fri 28 November 2025 |
20.54 (2.55%) |
20.00 |
20.00 - 20.66 |
1.0279 times |
Fri 21 November 2025 |
20.03 (-2.91%) |
20.60 |
19.84 - 20.60 |
1.4024 times |
Fri 14 November 2025 |
20.63 (-1.9%) |
21.06 |
20.55 - 21.25 |
1.0045 times |
Fri 07 November 2025 |
21.03 (-0.8%) |
21.03 |
20.84 - 21.37 |
0.7746 times |
Fri 31 October 2025 |
21.20 (0%) |
21.58 |
21.19 - 21.58 |
0.3831 times |
Fri 31 October 2025 |
21.20 (-2.84%) |
21.96 |
21.19 - 21.97 |
1.3492 times |
Fri 24 October 2025 |
21.82 (2.54%) |
21.32 |
21.20 - 21.91 |
0.7874 times |
Fri 17 October 2025 |
21.28 (-1.48%) |
21.61 |
21.27 - 21.77 |
1.0045 times |
Fri 10 October 2025 |
21.60 (-1.19%) |
21.74 |
21.55 - 21.98 |
1.1428 times |
Fri 03 October 2025 |
21.86 (1.58%) |
21.39 |
21.25 - 22.12 |
1.6918 times |
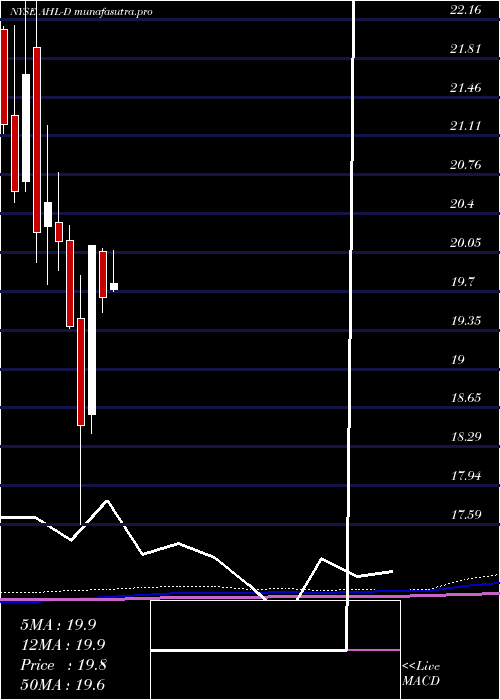
Monthly price and charts AspenInsurance Strong monthly Stock price targets for AspenInsurance AHL-D are 19.9 and 20.41 | Monthly Target 1 | 19.8 | | Monthly Target 2 | 19.99 | | Monthly Target 3 | 20.306666666667 | | Monthly Target 4 | 20.5 | | Monthly Target 5 | 20.82 |
Monthly price and volumes Aspen Insurance
| Date |
Closing |
Open |
Range |
Volume |
Thu 04 December 2025 |
20.19 (-1.7%) |
20.62 |
20.11 - 20.62 |
0.1661 times |
Fri 28 November 2025 |
20.54 (-3.11%) |
21.03 |
19.84 - 21.37 |
0.6223 times |
Fri 31 October 2025 |
21.20 (-0.38%) |
21.39 |
21.19 - 22.12 |
0.8365 times |
Tue 30 September 2025 |
21.28 (-2.03%) |
21.52 |
21.09 - 22.05 |
0.8079 times |
Fri 29 August 2025 |
21.72 (5.69%) |
20.55 |
20.16 - 22.25 |
1.8803 times |
Thu 31 July 2025 |
20.55 (4.58%) |
19.72 |
19.44 - 20.59 |
1.0599 times |
Mon 30 June 2025 |
19.65 (-2.34%) |
20.06 |
19.51 - 20.09 |
1.0709 times |
Fri 30 May 2025 |
20.12 (8.82%) |
18.59 |
18.41 - 20.12 |
1.1536 times |
Wed 30 April 2025 |
18.49 (-4.59%) |
19.45 |
17.59 - 19.84 |
1.5177 times |
Mon 31 March 2025 |
19.38 (-3.82%) |
20.16 |
19.36 - 20.30 |
0.8848 times |
Fri 28 February 2025 |
20.15 (-1.71%) |
20.32 |
19.89 - 20.78 |
0.7141 times |
DMA SMA EMA moving averages of Aspen Insurance AHL-D
DMA (daily moving average) of Aspen Insurance AHL-D
| DMA period | DMA value | | 5 day DMA | 20.33 | | 12 day DMA | 20.23 | | 20 day DMA | 20.48 | | 35 day DMA | 20.91 | | 50 day DMA | 21.13 | | 100 day DMA | 20.99 | | 150 day DMA | 20.52 | | 200 day DMA | 20.19 | EMA (exponential moving average) of Aspen Insurance AHL-D
| EMA period | EMA current | EMA prev | EMA prev2 | | 5 day EMA | 20.28 | 20.32 | 20.33 | | 12 day EMA | 20.34 | 20.37 | 20.39 | | 20 day EMA | 20.51 | 20.54 | 20.57 | | 35 day EMA | 20.78 | 20.82 | 20.85 | | 50 day EMA | 21.09 | 21.13 | 21.16 |
SMA (simple moving average) of Aspen Insurance AHL-D
| SMA period | SMA current | SMA prev | SMA prev2 | | 5 day SMA | 20.33 | 20.35 | 20.36 | | 12 day SMA | 20.23 | 20.24 | 20.27 | | 20 day SMA | 20.48 | 20.53 | 20.57 | | 35 day SMA | 20.91 | 20.95 | 20.99 | | 50 day SMA | 21.13 | 21.16 | 21.19 | | 100 day SMA | 20.99 | 20.99 | 20.98 | | 150 day SMA | 20.52 | 20.51 | 20.5 | | 200 day SMA | 20.19 | 20.2 | 20.2 |
|
|
