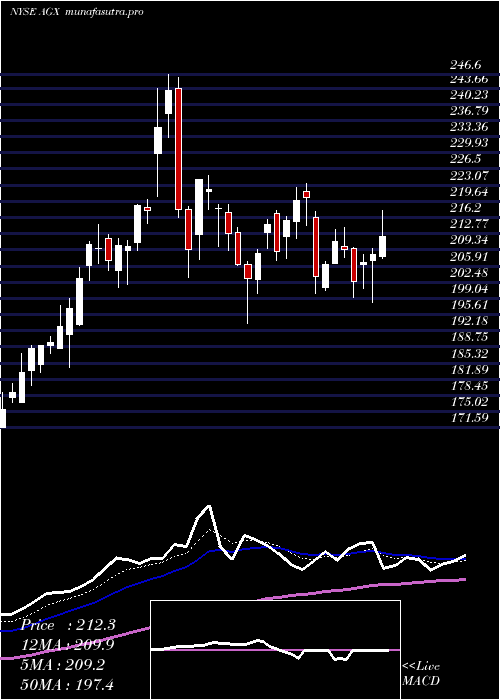
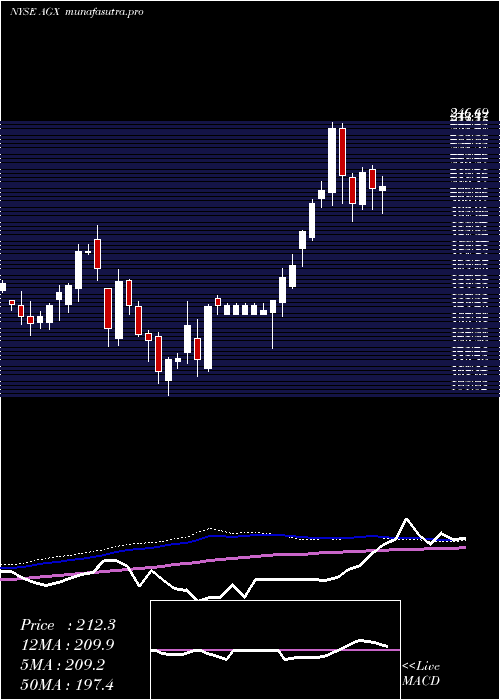
ArganInc AGX full analysis,charts,indicators,moving averages,SMA,DMA,EMA,ADX,MACD,RSIArgan Inc AGX WideScreen charts, DMA,SMA,EMA technical analysis, forecast prediction, by indicators ADX,MACD,RSI,CCI NYSE stock exchange
operates under Basic Industries sector & deals in Engineering Construction
Daily price and charts and targets ArganInc Strong Daily Stock price targets for ArganInc AGX are 294.99 and 335.44 | Daily Target 1 | 261.79 | | Daily Target 2 | 287.74 | | Daily Target 3 | 302.23666666667 | | Daily Target 4 | 328.19 | | Daily Target 5 | 342.69 |
Daily price and volume Argan Inc
| Date |
Closing |
Open |
Range |
Volume |
Fri 05 December 2025 |
313.70 (-12.05%) |
296.81 |
276.28 - 316.73 |
2.9107 times |
Thu 04 December 2025 |
356.69 (1.6%) |
348.74 |
347.67 - 368.21 |
0.6232 times |
Wed 03 December 2025 |
351.09 (-1.79%) |
355.98 |
343.01 - 359.05 |
0.8911 times |
Tue 02 December 2025 |
357.48 (-1.72%) |
365.76 |
355.17 - 373.17 |
0.7576 times |
Mon 01 December 2025 |
363.73 (-7.96%) |
370.66 |
356.39 - 374.30 |
1.0398 times |
Fri 28 November 2025 |
395.20 (3.83%) |
384.99 |
380.91 - 396.54 |
0.277 times |
Wed 26 November 2025 |
380.62 (1.96%) |
375.15 |
363.35 - 388.61 |
0.9438 times |
Tue 25 November 2025 |
373.29 (0.36%) |
367.47 |
360.00 - 374.69 |
0.4522 times |
Mon 24 November 2025 |
371.95 (10.92%) |
342.31 |
342.31 - 384.35 |
1.0741 times |
Fri 21 November 2025 |
335.33 (-5.09%) |
345.00 |
322.22 - 353.58 |
1.0306 times |
Thu 20 November 2025 |
353.30 (-1.51%) |
373.38 |
350.71 - 399.30 |
1.3773 times |
Weekly price and charts ArganInc Strong weekly Stock price targets for ArganInc AGX are 245.98 and 344 | Weekly Target 1 | 223.41 | | Weekly Target 2 | 268.55 | | Weekly Target 3 | 321.42666666667 | | Weekly Target 4 | 366.57 | | Weekly Target 5 | 419.45 |
Weekly price and volumes for Argan Inc
| Date |
Closing |
Open |
Range |
Volume |
Fri 05 December 2025 |
313.70 (-20.62%) |
370.66 |
276.28 - 374.30 |
1.7751 times |
Fri 28 November 2025 |
395.20 (17.85%) |
342.31 |
342.31 - 396.54 |
0.7837 times |
Fri 21 November 2025 |
335.33 (-4.64%) |
351.86 |
322.22 - 399.30 |
1.241 times |
Fri 14 November 2025 |
351.64 (13%) |
327.50 |
318.50 - 365.09 |
1.1442 times |
Fri 07 November 2025 |
311.19 (1.63%) |
303.88 |
290.00 - 331.01 |
0.5328 times |
Fri 31 October 2025 |
306.21 (0%) |
307.06 |
299.46 - 316.40 |
0.2529 times |
Fri 31 October 2025 |
306.21 (3.26%) |
300.52 |
280.65 - 316.40 |
1.0018 times |
Fri 24 October 2025 |
296.55 (4.44%) |
290.00 |
257.62 - 300.91 |
1.1488 times |
Fri 17 October 2025 |
283.94 (10.85%) |
271.40 |
271.40 - 320.00 |
1.3414 times |
Fri 10 October 2025 |
256.15 (-2.33%) |
262.00 |
255.60 - 282.20 |
0.7783 times |
Fri 03 October 2025 |
262.26 (-1.68%) |
272.82 |
261.00 - 283.35 |
0.8399 times |
Monthly price and charts ArganInc Strong monthly Stock price targets for ArganInc AGX are 245.98 and 344 | Monthly Target 1 | 223.41 | | Monthly Target 2 | 268.55 | | Monthly Target 3 | 321.42666666667 | | Monthly Target 4 | 366.57 | | Monthly Target 5 | 419.45 |
Monthly price and volumes Argan Inc
| Date |
Closing |
Open |
Range |
Volume |
Fri 05 December 2025 |
313.70 (-20.62%) |
370.66 |
276.28 - 374.30 |
0.374 times |
Fri 28 November 2025 |
395.20 (29.06%) |
303.88 |
290.00 - 399.30 |
0.78 times |
Fri 31 October 2025 |
306.21 (13.39%) |
266.99 |
255.60 - 320.00 |
1.0486 times |
Tue 30 September 2025 |
270.05 (18.33%) |
220.00 |
197.00 - 279.00 |
1.2098 times |
Fri 29 August 2025 |
228.22 (-6.84%) |
236.50 |
203.55 - 245.18 |
0.8703 times |
Thu 31 July 2025 |
244.98 (11.11%) |
216.14 |
196.90 - 253.79 |
1.2688 times |
Mon 30 June 2025 |
220.48 (4.84%) |
209.13 |
193.82 - 246.60 |
1.3747 times |
Fri 30 May 2025 |
210.30 (37.33%) |
157.79 |
155.65 - 214.75 |
0.9889 times |
Wed 30 April 2025 |
153.13 (16.74%) |
131.76 |
111.16 - 154.10 |
1.0911 times |
Mon 31 March 2025 |
131.17 (0.61%) |
132.48 |
101.02 - 150.84 |
0.9939 times |
Fri 28 February 2025 |
130.37 (-4.7%) |
131.23 |
119.20 - 168.26 |
0.9876 times |
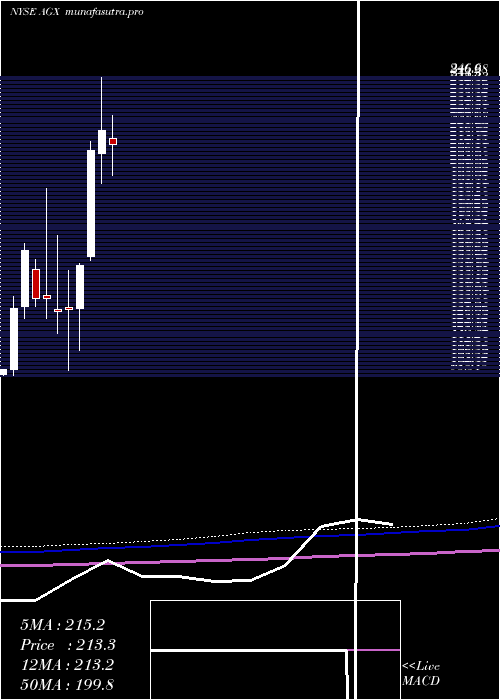
DMA SMA EMA moving averages of Argan Inc AGX
DMA (daily moving average) of Argan Inc AGX
| DMA period | DMA value | | 5 day DMA | 348.54 | | 12 day DMA | 359.26 | | 20 day DMA | 352.42 | | 35 day DMA | 327.82 | | 50 day DMA | 312.78 | | 100 day DMA | 271.85 | | 150 day DMA | 248.96 | | 200 day DMA | 219.89 | EMA (exponential moving average) of Argan Inc AGX
| EMA period | EMA current | EMA prev | EMA prev2 | | 5 day EMA | 344.69 | 360.19 | 361.94 | | 12 day EMA | 351.46 | 358.32 | 358.62 | | 20 day EMA | 346.09 | 349.5 | 348.74 | | 35 day EMA | 331.33 | 332.37 | 330.94 | | 50 day EMA | 312.11 | 312.04 | 310.22 |
SMA (simple moving average) of Argan Inc AGX
| SMA period | SMA current | SMA prev | SMA prev2 | | 5 day SMA | 348.54 | 364.84 | 369.62 | | 12 day SMA | 359.26 | 361.81 | 360.95 | | 20 day SMA | 352.42 | 352.3 | 350.71 | | 35 day SMA | 327.82 | 327.33 | 326.07 | | 50 day SMA | 312.78 | 311.67 | 309.75 | | 100 day SMA | 271.85 | 270.85 | 269.5 | | 150 day SMA | 248.96 | 247.93 | 246.57 | | 200 day SMA | 219.89 | 218.99 | 217.92 |
|
|
