AssuredGuaranty AGO full analysis,charts,indicators,moving averages,SMA,DMA,EMA,ADX,MACD,RSIAssured Guaranty AGO WideScreen charts, DMA,SMA,EMA technical analysis, forecast prediction, by indicators ADX,MACD,RSI,CCI NYSE stock exchange
operates under Finance sector & deals in Property Casualty Insurers
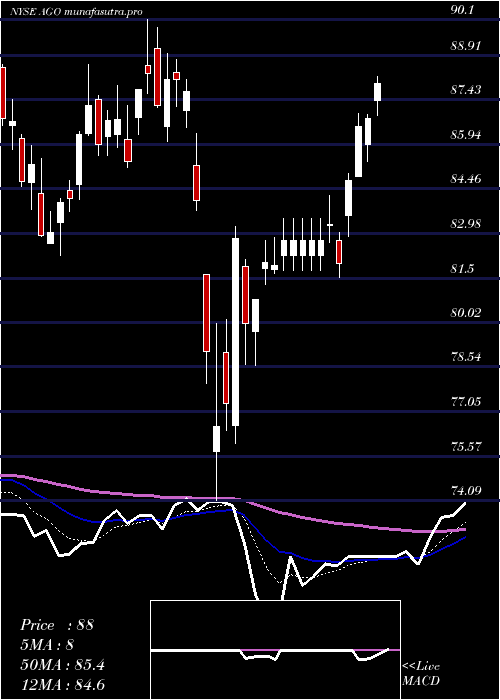
Daily price and charts and targets AssuredGuaranty Strong Daily Stock price targets for AssuredGuaranty AGO are 81.46 and 84 | Daily Target 1 | 79.42 | | Daily Target 2 | 80.96 | | Daily Target 3 | 81.956666666667 | | Daily Target 4 | 83.5 | | Daily Target 5 | 84.5 |
Daily price and volume Assured Guaranty
| Date |
Closing |
Open |
Range |
Volume |
Tue 21 October 2025 |
82.51 (1.86%) |
81.12 |
80.41 - 82.95 |
1.0796 times |
Mon 20 October 2025 |
81.00 (1.26%) |
80.17 |
80.09 - 81.24 |
0.7632 times |
Fri 17 October 2025 |
79.99 (1.07%) |
79.60 |
78.77 - 80.24 |
1.0738 times |
Thu 16 October 2025 |
79.14 (-2.27%) |
80.31 |
79.05 - 80.58 |
1.3685 times |
Wed 15 October 2025 |
80.98 (-1.58%) |
82.06 |
80.42 - 82.08 |
1.1106 times |
Tue 14 October 2025 |
82.28 (1.44%) |
81.02 |
81.02 - 82.70 |
0.8256 times |
Mon 13 October 2025 |
81.11 (0.75%) |
80.43 |
80.43 - 81.56 |
0.8756 times |
Fri 10 October 2025 |
80.51 (-1.69%) |
82.31 |
80.43 - 82.52 |
1.0137 times |
Thu 09 October 2025 |
81.89 (-0.73%) |
82.50 |
81.61 - 83.33 |
0.8845 times |
Wed 08 October 2025 |
82.49 (-0.15%) |
83.17 |
82.34 - 83.68 |
1.0048 times |
Tue 07 October 2025 |
82.61 (-1.34%) |
83.98 |
82.60 - 85.18 |
1.0929 times |
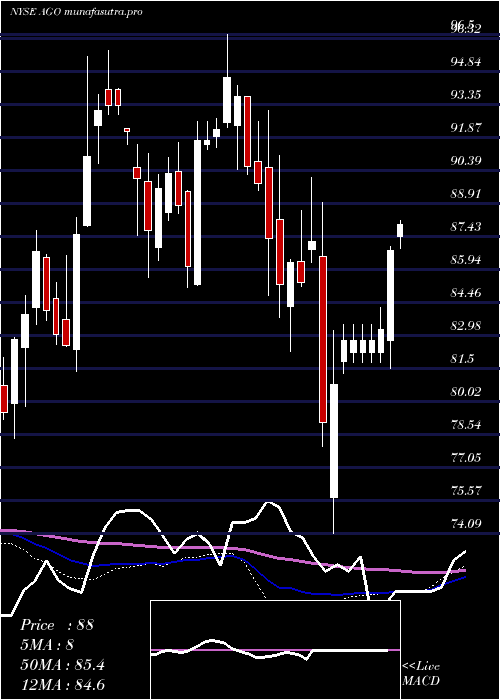
Weekly price and charts AssuredGuaranty Strong weekly Stock price targets for AssuredGuaranty AGO are 81.3 and 84.16 | Weekly Target 1 | 78.99 | | Weekly Target 2 | 80.75 | | Weekly Target 3 | 81.85 | | Weekly Target 4 | 83.61 | | Weekly Target 5 | 84.71 |
Weekly price and volumes for Assured Guaranty
| Date |
Closing |
Open |
Range |
Volume |
Tue 21 October 2025 |
82.51 (3.15%) |
80.17 |
80.09 - 82.95 |
0.3317 times |
Fri 17 October 2025 |
79.99 (-0.65%) |
80.43 |
78.77 - 82.70 |
0.9458 times |
Fri 10 October 2025 |
80.51 (-4.47%) |
84.42 |
80.43 - 85.18 |
0.8294 times |
Fri 03 October 2025 |
84.28 (-0.44%) |
84.39 |
83.45 - 85.55 |
1.2385 times |
Fri 26 September 2025 |
84.65 (1.22%) |
83.60 |
82.84 - 85.36 |
1.085 times |
Fri 19 September 2025 |
83.63 (1.38%) |
82.37 |
80.19 - 83.92 |
1.8814 times |
Fri 12 September 2025 |
82.49 (0.38%) |
82.35 |
80.90 - 83.42 |
1.1141 times |
Fri 05 September 2025 |
82.18 (-0.02%) |
81.91 |
80.61 - 83.39 |
0.9776 times |
Fri 29 August 2025 |
82.20 (0%) |
82.20 |
81.48 - 82.64 |
0.2386 times |
Fri 29 August 2025 |
82.20 (-0.38%) |
82.26 |
80.79 - 82.64 |
1.3579 times |
Fri 22 August 2025 |
82.51 (2.5%) |
80.20 |
80.01 - 82.58 |
1.2151 times |
Monthly price and charts AssuredGuaranty Strong monthly Stock price targets for AssuredGuaranty AGO are 77.25 and 84.03 | Monthly Target 1 | 75.5 | | Monthly Target 2 | 79 | | Monthly Target 3 | 82.276666666667 | | Monthly Target 4 | 85.78 | | Monthly Target 5 | 89.06 |
Monthly price and volumes Assured Guaranty
| Date |
Closing |
Open |
Range |
Volume |
Tue 21 October 2025 |
82.51 (-2.53%) |
84.35 |
78.77 - 85.55 |
0.5801 times |
Tue 30 September 2025 |
84.65 (2.98%) |
81.91 |
80.19 - 85.36 |
1.0556 times |
Fri 29 August 2025 |
82.20 (-2.81%) |
83.91 |
80.01 - 86.78 |
1.1988 times |
Thu 31 July 2025 |
84.58 (-2.89%) |
86.53 |
81.66 - 87.90 |
0.9897 times |
Mon 30 June 2025 |
87.10 (3.02%) |
84.19 |
82.89 - 88.01 |
1.0357 times |
Fri 30 May 2025 |
84.55 (-3.62%) |
87.19 |
83.05 - 90.61 |
1.2484 times |
Wed 30 April 2025 |
87.73 (-0.42%) |
88.32 |
74.09 - 88.94 |
1.0941 times |
Mon 31 March 2025 |
88.10 (0.88%) |
88.19 |
82.26 - 91.07 |
1.2854 times |
Fri 28 February 2025 |
87.33 (-7.68%) |
92.43 |
84.81 - 94.22 |
0.8125 times |
Fri 31 January 2025 |
94.60 (5.1%) |
90.38 |
85.16 - 96.50 |
0.6997 times |
Tue 31 December 2024 |
90.01 (-3.55%) |
92.27 |
85.58 - 92.27 |
0.7674 times |

DMA SMA EMA moving averages of Assured Guaranty AGO
DMA (daily moving average) of Assured Guaranty AGO
| DMA period | DMA value | | 5 day DMA | 80.72 | | 12 day DMA | 81.52 | | 20 day DMA | 82.65 | | 35 day DMA | 82.55 | | 50 day DMA | 82.26 | | 100 day DMA | 83.39 | | 150 day DMA | 84 | | 200 day DMA | 85.52 | EMA (exponential moving average) of Assured Guaranty AGO
| EMA period | EMA current | EMA prev | EMA prev2 | | 5 day EMA | 81.29 | 80.68 | 80.52 | | 12 day EMA | 81.6 | 81.44 | 81.52 | | 20 day EMA | 81.98 | 81.92 | 82.02 | | 35 day EMA | 82.22 | 82.2 | 82.27 | | 50 day EMA | 82.2 | 82.19 | 82.24 |
SMA (simple moving average) of Assured Guaranty AGO
| SMA period | SMA current | SMA prev | SMA prev2 | | 5 day SMA | 80.72 | 80.68 | 80.7 | | 12 day SMA | 81.52 | 81.67 | 81.96 | | 20 day SMA | 82.65 | 82.71 | 82.84 | | 35 day SMA | 82.55 | 82.51 | 82.54 | | 50 day SMA | 82.26 | 82.25 | 82.28 | | 100 day SMA | 83.39 | 83.41 | 83.45 | | 150 day SMA | 84 | 84.02 | 84.06 | | 200 day SMA | 85.52 | 85.56 | 85.6 |
|
|
