FederalAgricultural AGM-F full analysis,charts,indicators,moving averages,SMA,DMA,EMA,ADX,MACD,RSIFederal Agricultural AGM-F WideScreen charts, DMA,SMA,EMA technical analysis, forecast prediction, by indicators ADX,MACD,RSI,CCI NYSE stock exchange
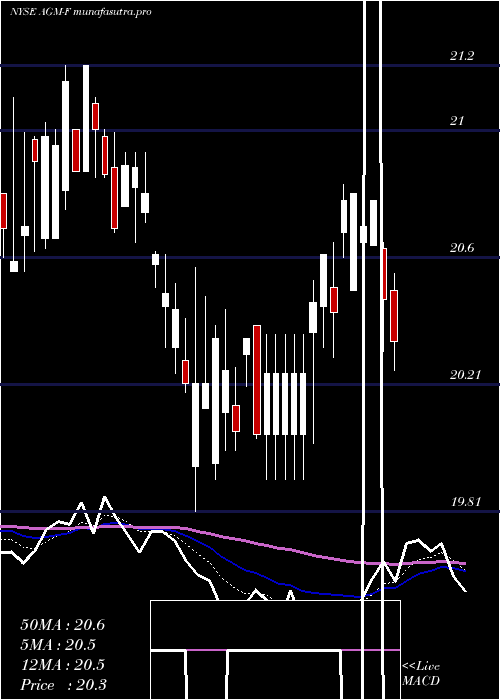
Daily price and charts and targets FederalAgricultural Strong Daily Stock price targets for FederalAgricultural AGM-F are 19.32 and 19.55 | Daily Target 1 | 19.14 | | Daily Target 2 | 19.26 | | Daily Target 3 | 19.373333333333 | | Daily Target 4 | 19.49 | | Daily Target 5 | 19.6 |
Daily price and volume Federal Agricultural
| Date |
Closing |
Open |
Range |
Volume |
Fri 05 December 2025 |
19.37 (0.05%) |
19.26 |
19.26 - 19.49 |
0.6941 times |
Thu 04 December 2025 |
19.36 (0.16%) |
19.35 |
19.22 - 19.43 |
0.6143 times |
Wed 03 December 2025 |
19.33 (0.1%) |
19.36 |
19.26 - 19.48 |
1.7076 times |
Tue 02 December 2025 |
19.31 (-0.62%) |
19.44 |
19.31 - 19.51 |
1.7383 times |
Mon 01 December 2025 |
19.43 (-0.26%) |
19.40 |
19.34 - 19.45 |
1.6523 times |
Fri 28 November 2025 |
19.48 (-0.26%) |
19.57 |
19.35 - 19.57 |
0.9214 times |
Wed 26 November 2025 |
19.53 (0.26%) |
19.46 |
19.41 - 19.57 |
0.3501 times |
Tue 25 November 2025 |
19.48 (0.05%) |
19.51 |
19.33 - 19.51 |
1.1916 times |
Mon 24 November 2025 |
19.47 (-0.15%) |
19.46 |
19.37 - 19.54 |
0.6265 times |
Fri 21 November 2025 |
19.50 (0.52%) |
19.41 |
19.32 - 19.50 |
0.5037 times |
Thu 20 November 2025 |
19.40 (0.1%) |
19.40 |
19.32 - 19.53 |
1.5725 times |
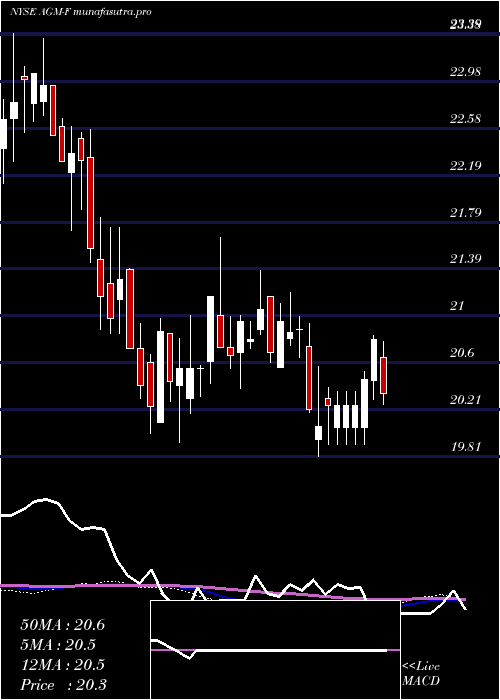
Weekly price and charts FederalAgricultural Strong weekly Stock price targets for FederalAgricultural AGM-F are 19.15 and 19.44 | Weekly Target 1 | 19.08 | | Weekly Target 2 | 19.22 | | Weekly Target 3 | 19.366666666667 | | Weekly Target 4 | 19.51 | | Weekly Target 5 | 19.66 |
Weekly price and volumes for Federal Agricultural
| Date |
Closing |
Open |
Range |
Volume |
Fri 05 December 2025 |
19.37 (-0.56%) |
19.40 |
19.22 - 19.51 |
1.6325 times |
Fri 28 November 2025 |
19.48 (-0.1%) |
19.46 |
19.33 - 19.57 |
0.7873 times |
Fri 21 November 2025 |
19.50 (-0.05%) |
19.58 |
19.32 - 19.61 |
1.5934 times |
Fri 14 November 2025 |
19.51 (-0.86%) |
19.50 |
19.31 - 19.85 |
1.2647 times |
Fri 07 November 2025 |
19.68 (-0.2%) |
19.53 |
19.41 - 19.75 |
0.7669 times |
Fri 31 October 2025 |
19.72 (0%) |
19.95 |
19.65 - 20.00 |
0.5697 times |
Fri 31 October 2025 |
19.72 (-2.62%) |
20.40 |
19.65 - 20.53 |
1.3695 times |
Fri 24 October 2025 |
20.25 (-0.59%) |
20.25 |
20.10 - 20.54 |
0.457 times |
Fri 17 October 2025 |
20.37 (1.39%) |
20.15 |
20.02 - 20.47 |
0.6292 times |
Fri 10 October 2025 |
20.09 (-1.33%) |
20.36 |
20.09 - 20.55 |
0.9297 times |
Fri 03 October 2025 |
20.36 (-1.55%) |
20.53 |
20.22 - 20.74 |
0.4508 times |
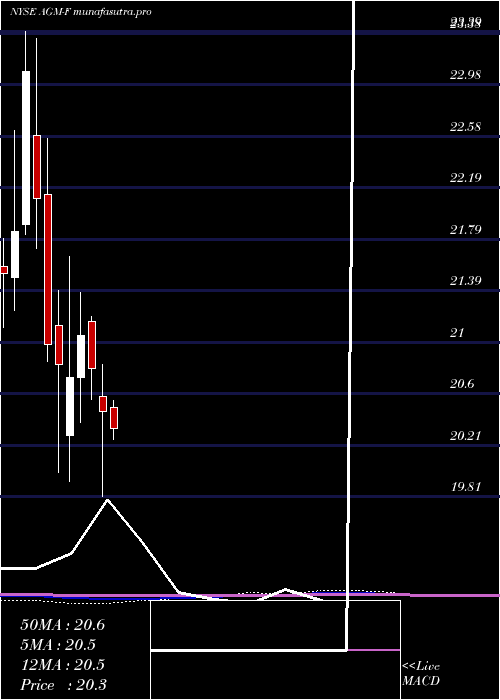
Monthly price and charts FederalAgricultural Strong monthly Stock price targets for FederalAgricultural AGM-F are 19.15 and 19.44 | Monthly Target 1 | 19.08 | | Monthly Target 2 | 19.22 | | Monthly Target 3 | 19.366666666667 | | Monthly Target 4 | 19.51 | | Monthly Target 5 | 19.66 |
Monthly price and volumes Federal Agricultural
| Date |
Closing |
Open |
Range |
Volume |
Fri 05 December 2025 |
19.37 (-0.56%) |
19.40 |
19.22 - 19.51 |
0.5261 times |
Fri 28 November 2025 |
19.48 (-1.22%) |
19.53 |
19.31 - 19.85 |
1.4221 times |
Fri 31 October 2025 |
19.72 (-4.55%) |
20.22 |
19.65 - 20.57 |
1.3439 times |
Tue 30 September 2025 |
20.66 (2.53%) |
20.20 |
20.12 - 20.98 |
0.7496 times |
Fri 29 August 2025 |
20.15 (3.87%) |
19.49 |
19.34 - 20.40 |
0.9842 times |
Thu 31 July 2025 |
19.40 (-1.42%) |
19.22 |
19.06 - 19.72 |
1.2242 times |
Mon 30 June 2025 |
19.68 (1.08%) |
19.65 |
19.26 - 20.40 |
1.075 times |
Fri 30 May 2025 |
19.47 (-4.89%) |
20.50 |
19.47 - 21.39 |
1.0518 times |
Wed 30 April 2025 |
20.47 (-1.59%) |
20.58 |
19.81 - 20.83 |
0.7157 times |
Mon 31 March 2025 |
20.80 (-1.19%) |
21.16 |
20.56 - 21.20 |
0.9075 times |
Fri 28 February 2025 |
21.05 (1.54%) |
20.73 |
20.38 - 21.38 |
1.1118 times |
DMA SMA EMA moving averages of Federal Agricultural AGM-F
DMA (daily moving average) of Federal Agricultural AGM-F
| DMA period | DMA value | | 5 day DMA | 19.36 | | 12 day DMA | 19.42 | | 20 day DMA | 19.48 | | 35 day DMA | 19.72 | | 50 day DMA | 19.92 | | 100 day DMA | 19.96 | | 150 day DMA | 19.88 | | 200 day DMA | 20.07 | EMA (exponential moving average) of Federal Agricultural AGM-F
| EMA period | EMA current | EMA prev | EMA prev2 | | 5 day EMA | 19.38 | 19.38 | 19.39 | | 12 day EMA | 19.43 | 19.44 | 19.46 | | 20 day EMA | 19.51 | 19.53 | 19.55 | | 35 day EMA | 19.72 | 19.74 | 19.76 | | 50 day EMA | 19.94 | 19.96 | 19.98 |
SMA (simple moving average) of Federal Agricultural AGM-F
| SMA period | SMA current | SMA prev | SMA prev2 | | 5 day SMA | 19.36 | 19.38 | 19.42 | | 12 day SMA | 19.42 | 19.43 | 19.44 | | 20 day SMA | 19.48 | 19.49 | 19.5 | | 35 day SMA | 19.72 | 19.75 | 19.77 | | 50 day SMA | 19.92 | 19.95 | 19.98 | | 100 day SMA | 19.96 | 19.96 | 19.96 | | 150 day SMA | 19.88 | 19.88 | 19.89 | | 200 day SMA | 20.07 | 20.08 | 20.09 |
|
|
