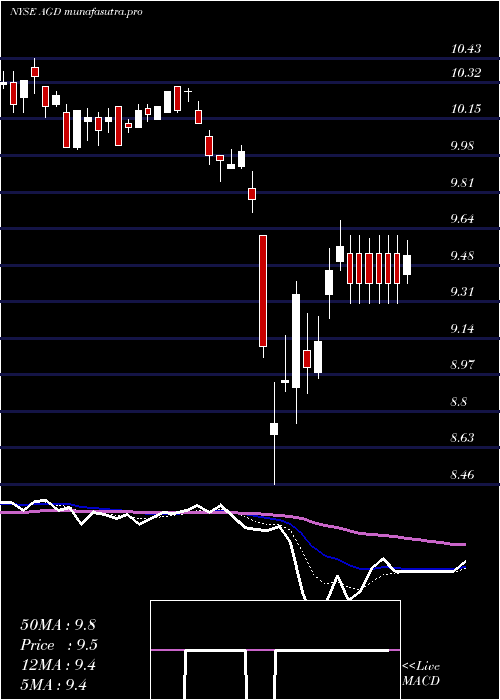
AberdeenGlobal AGD full analysis,charts,indicators,moving averages,SMA,DMA,EMA,ADX,MACD,RSIAberdeen Global AGD WideScreen charts, DMA,SMA,EMA technical analysis, forecast prediction, by indicators ADX,MACD,RSI,CCI NYSE stock exchange
operates under N A sector & deals in N A
Daily price and charts and targets AberdeenGlobal Strong Daily Stock price targets for AberdeenGlobal AGD are 12.07 and 12.44 | Daily Target 1 | 11.76 | | Daily Target 2 | 12 | | Daily Target 3 | 12.126666666667 | | Daily Target 4 | 12.37 | | Daily Target 5 | 12.5 |
Daily price and volume Aberdeen Global
| Date |
Closing |
Open |
Range |
Volume |
Tue 21 October 2025 |
12.25 (3.2%) |
11.93 |
11.88 - 12.25 |
0.3865 times |
Mon 20 October 2025 |
11.87 (3.58%) |
11.48 |
11.46 - 11.89 |
0.4133 times |
Fri 17 October 2025 |
11.46 (1.42%) |
11.28 |
11.28 - 11.49 |
0.369 times |
Thu 16 October 2025 |
11.30 (-0.96%) |
11.41 |
11.24 - 11.45 |
0.225 times |
Wed 15 October 2025 |
11.41 (2.33%) |
11.25 |
11.25 - 11.49 |
0.5262 times |
Tue 14 October 2025 |
11.15 (0.54%) |
10.83 |
10.78 - 11.38 |
1.2414 times |
Mon 13 October 2025 |
11.09 (-1.6%) |
11.55 |
11.02 - 11.76 |
1.3735 times |
Fri 10 October 2025 |
11.27 (-9.41%) |
12.20 |
11.14 - 12.40 |
2.197 times |
Thu 09 October 2025 |
12.44 (-8.66%) |
13.62 |
12.21 - 13.62 |
2.3539 times |
Wed 08 October 2025 |
13.62 (-1.94%) |
13.89 |
13.56 - 13.89 |
0.9143 times |
Tue 07 October 2025 |
13.89 (1.39%) |
13.79 |
13.77 - 13.98 |
0.4233 times |
Weekly price and charts AberdeenGlobal Strong weekly Stock price targets for AberdeenGlobal AGD are 11.86 and 12.65 | Weekly Target 1 | 11.2 | | Weekly Target 2 | 11.72 | | Weekly Target 3 | 11.986666666667 | | Weekly Target 4 | 12.51 | | Weekly Target 5 | 12.78 |
Weekly price and volumes for Aberdeen Global
| Date |
Closing |
Open |
Range |
Volume |
Tue 21 October 2025 |
12.25 (6.89%) |
11.48 |
11.46 - 12.25 |
0.359 times |
Fri 17 October 2025 |
11.46 (1.69%) |
11.55 |
10.78 - 11.76 |
1.6768 times |
Fri 10 October 2025 |
11.27 (-17.56%) |
13.67 |
11.14 - 13.98 |
2.8256 times |
Fri 03 October 2025 |
13.67 (4.75%) |
13.11 |
12.95 - 13.77 |
0.8519 times |
Fri 26 September 2025 |
13.05 (-0.84%) |
13.18 |
12.81 - 13.31 |
0.8887 times |
Fri 19 September 2025 |
13.16 (3.38%) |
12.82 |
12.77 - 13.42 |
1.1283 times |
Fri 12 September 2025 |
12.73 (4.69%) |
12.20 |
12.17 - 12.75 |
0.7233 times |
Fri 05 September 2025 |
12.16 (1.33%) |
11.95 |
11.91 - 12.28 |
0.6907 times |
Fri 29 August 2025 |
12.00 (0%) |
12.02 |
11.94 - 12.02 |
0.1506 times |
Fri 29 August 2025 |
12.00 (2.56%) |
11.76 |
11.64 - 12.02 |
0.705 times |
Fri 22 August 2025 |
11.70 (2.09%) |
11.46 |
11.46 - 11.71 |
0.6339 times |

Monthly price and charts AberdeenGlobal Strong monthly Stock price targets for AberdeenGlobal AGD are 9.92 and 13.12 | Monthly Target 1 | 9.14 | | Monthly Target 2 | 10.69 | | Monthly Target 3 | 12.336666666667 | | Monthly Target 4 | 13.89 | | Monthly Target 5 | 15.54 |
Monthly price and volumes Aberdeen Global
| Date |
Closing |
Open |
Range |
Volume |
Tue 21 October 2025 |
12.25 (-8.03%) |
13.29 |
10.78 - 13.98 |
1.5511 times |
Tue 30 September 2025 |
13.32 (11%) |
11.95 |
11.91 - 13.42 |
1.0927 times |
Fri 29 August 2025 |
12.00 (6.48%) |
11.22 |
11.03 - 12.02 |
0.8467 times |
Thu 31 July 2025 |
11.27 (2.08%) |
11.02 |
11.01 - 11.54 |
0.8667 times |
Mon 30 June 2025 |
11.04 (6.77%) |
10.35 |
10.25 - 11.04 |
0.9073 times |
Fri 30 May 2025 |
10.34 (3.5%) |
10.10 |
10.01 - 10.44 |
0.8495 times |
Wed 30 April 2025 |
9.99 (0.3%) |
9.92 |
8.46 - 10.03 |
1.1773 times |
Mon 31 March 2025 |
9.96 (-3.58%) |
10.39 |
9.86 - 10.43 |
0.5749 times |
Fri 28 February 2025 |
10.33 (1.77%) |
10.06 |
10.01 - 10.51 |
0.5834 times |
Fri 31 January 2025 |
10.15 (3.57%) |
9.85 |
9.71 - 10.37 |
1.5503 times |
Tue 31 December 2024 |
9.80 (-3.64%) |
10.24 |
9.60 - 10.30 |
0.6255 times |

DMA SMA EMA moving averages of Aberdeen Global AGD
DMA (daily moving average) of Aberdeen Global AGD
| DMA period | DMA value | | 5 day DMA | 11.66 | | 12 day DMA | 12.12 | | 20 day DMA | 12.58 | | 35 day DMA | 12.63 | | 50 day DMA | 12.35 | | 100 day DMA | 11.66 | | 150 day DMA | 11.05 | | 200 day DMA | 10.84 | EMA (exponential moving average) of Aberdeen Global AGD
| EMA period | EMA current | EMA prev | EMA prev2 | | 5 day EMA | 11.84 | 11.63 | 11.51 | | 12 day EMA | 12.05 | 12.01 | 12.03 | | 20 day EMA | 12.26 | 12.26 | 12.3 | | 35 day EMA | 12.26 | 12.26 | 12.28 | | 50 day EMA | 12.2 | 12.2 | 12.21 |
SMA (simple moving average) of Aberdeen Global AGD
| SMA period | SMA current | SMA prev | SMA prev2 | | 5 day SMA | 11.66 | 11.44 | 11.28 | | 12 day SMA | 12.12 | 12.24 | 12.38 | | 20 day SMA | 12.58 | 12.62 | 12.69 | | 35 day SMA | 12.63 | 12.62 | 12.63 | | 50 day SMA | 12.35 | 12.34 | 12.33 | | 100 day SMA | 11.66 | 11.64 | 11.62 | | 150 day SMA | 11.05 | 11.04 | 11.03 | | 200 day SMA | 10.84 | 10.82 | 10.82 |
|
|
