AgcoCorporation AGCO full analysis,charts,indicators,moving averages,SMA,DMA,EMA,ADX,MACD,RSIAgco Corporation AGCO WideScreen charts, DMA,SMA,EMA technical analysis, forecast prediction, by indicators ADX,MACD,RSI,CCI NYSE stock exchange
operates under Capital Goods sector & deals in Industrial Machinery Components
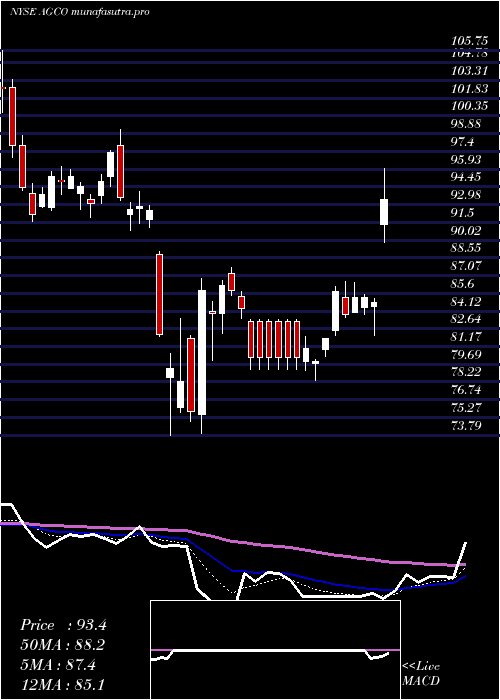
Daily price and charts and targets AgcoCorporation Strong Daily Stock price targets for AgcoCorporation AGCO are 104.6 and 107.07 | Daily Target 1 | 102.55 | | Daily Target 2 | 104.17 | | Daily Target 3 | 105.02 | | Daily Target 4 | 106.64 | | Daily Target 5 | 107.49 |
Daily price and volume Agco Corporation
| Date |
Closing |
Open |
Range |
Volume |
Thu 04 December 2025 |
105.79 (0.63%) |
105.24 |
103.40 - 105.87 |
0.7673 times |
Wed 03 December 2025 |
105.13 (0.83%) |
104.53 |
103.73 - 105.52 |
1.1569 times |
Tue 02 December 2025 |
104.26 (-2.38%) |
106.93 |
103.00 - 107.50 |
1.8207 times |
Mon 01 December 2025 |
106.80 (0.79%) |
105.47 |
104.62 - 108.57 |
0.9783 times |
Fri 28 November 2025 |
105.96 (0.36%) |
104.99 |
104.29 - 106.86 |
0.3497 times |
Wed 26 November 2025 |
105.58 (-4.99%) |
108.38 |
105.46 - 109.32 |
1.5368 times |
Tue 25 November 2025 |
111.12 (3.52%) |
108.49 |
107.85 - 111.63 |
1.0418 times |
Mon 24 November 2025 |
107.34 (1.26%) |
106.50 |
105.76 - 108.51 |
0.8114 times |
Fri 21 November 2025 |
106.00 (5.85%) |
100.73 |
100.25 - 106.39 |
0.85 times |
Thu 20 November 2025 |
100.14 (-1.06%) |
102.68 |
99.21 - 103.72 |
0.6871 times |
Wed 19 November 2025 |
101.21 (-0.87%) |
102.45 |
100.45 - 103.00 |
0.5003 times |
Weekly price and charts AgcoCorporation Strong weekly Stock price targets for AgcoCorporation AGCO are 104.4 and 109.97 | Weekly Target 1 | 100.22 | | Weekly Target 2 | 103 | | Weekly Target 3 | 105.78666666667 | | Weekly Target 4 | 108.57 | | Weekly Target 5 | 111.36 |
Weekly price and volumes for Agco Corporation
| Date |
Closing |
Open |
Range |
Volume |
Thu 04 December 2025 |
105.79 (-0.16%) |
105.47 |
103.00 - 108.57 |
1.2308 times |
Fri 28 November 2025 |
105.96 (-0.04%) |
106.50 |
104.29 - 111.63 |
0.9746 times |
Fri 21 November 2025 |
106.00 (1.5%) |
104.48 |
99.21 - 106.39 |
0.8126 times |
Fri 14 November 2025 |
104.43 (-1.07%) |
106.32 |
103.62 - 109.46 |
0.7919 times |
Fri 07 November 2025 |
105.56 (2.33%) |
104.21 |
100.69 - 107.62 |
0.7347 times |
Fri 31 October 2025 |
103.16 (0%) |
108.14 |
101.19 - 108.14 |
0.4355 times |
Fri 31 October 2025 |
103.16 (-5.07%) |
109.75 |
101.19 - 110.99 |
1.6518 times |
Fri 24 October 2025 |
108.67 (0.94%) |
106.87 |
106.87 - 111.68 |
0.9959 times |
Fri 17 October 2025 |
107.66 (3.75%) |
104.83 |
102.62 - 109.69 |
0.9341 times |
Fri 10 October 2025 |
103.77 (-4.48%) |
108.93 |
102.95 - 111.32 |
1.4381 times |
Fri 03 October 2025 |
108.64 (-1.04%) |
110.06 |
104.36 - 110.93 |
1.0809 times |
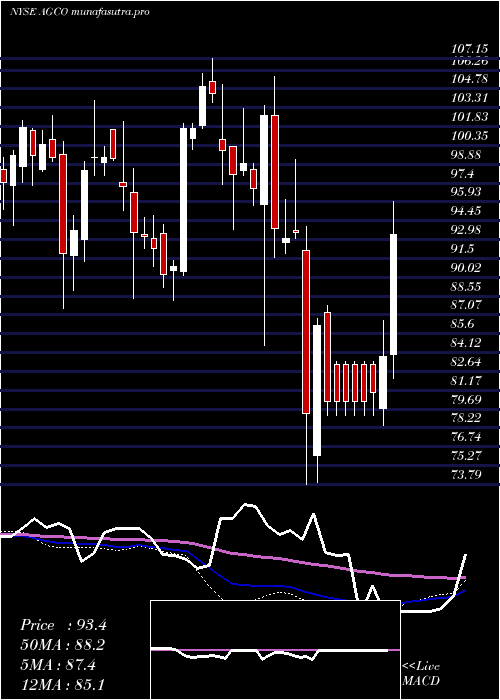
Monthly price and charts AgcoCorporation Strong monthly Stock price targets for AgcoCorporation AGCO are 104.4 and 109.97 | Monthly Target 1 | 100.22 | | Monthly Target 2 | 103 | | Monthly Target 3 | 105.78666666667 | | Monthly Target 4 | 108.57 | | Monthly Target 5 | 111.36 |
Monthly price and volumes Agco Corporation
| Date |
Closing |
Open |
Range |
Volume |
Thu 04 December 2025 |
105.79 (-0.16%) |
105.47 |
103.00 - 108.57 |
0.2397 times |
Fri 28 November 2025 |
105.96 (2.71%) |
104.21 |
99.21 - 111.63 |
0.6454 times |
Fri 31 October 2025 |
103.16 (-3.65%) |
106.60 |
101.19 - 111.68 |
1.1834 times |
Tue 30 September 2025 |
107.07 (-1.04%) |
107.00 |
104.41 - 112.46 |
1.0545 times |
Fri 29 August 2025 |
108.19 (-8.29%) |
117.01 |
107.26 - 117.76 |
1.0286 times |
Thu 31 July 2025 |
117.97 (14.36%) |
103.00 |
102.92 - 121.16 |
1.2535 times |
Mon 30 June 2025 |
103.16 (5.29%) |
98.27 |
95.96 - 104.07 |
0.7993 times |
Fri 30 May 2025 |
97.98 (15.5%) |
91.32 |
89.80 - 108.76 |
1.1215 times |
Wed 30 April 2025 |
84.83 (-8.36%) |
92.67 |
73.79 - 94.03 |
1.465 times |
Mon 31 March 2025 |
92.57 (-4.54%) |
95.69 |
84.70 - 105.75 |
1.209 times |
Fri 28 February 2025 |
96.97 (-7.14%) |
100.81 |
93.74 - 105.10 |
1.0174 times |
DMA SMA EMA moving averages of Agco Corporation AGCO
DMA (daily moving average) of Agco Corporation AGCO
| DMA period | DMA value | | 5 day DMA | 105.59 | | 12 day DMA | 105.12 | | 20 day DMA | 105.34 | | 35 day DMA | 106.13 | | 50 day DMA | 106.57 | | 100 day DMA | 108.61 | | 150 day DMA | 106.71 | | 200 day DMA | 102.35 | EMA (exponential moving average) of Agco Corporation AGCO
| EMA period | EMA current | EMA prev | EMA prev2 | | 5 day EMA | 105.61 | 105.52 | 105.71 | | 12 day EMA | 105.58 | 105.54 | 105.61 | | 20 day EMA | 105.65 | 105.64 | 105.69 | | 35 day EMA | 106.13 | 106.15 | 106.21 | | 50 day EMA | 106.69 | 106.73 | 106.8 |
SMA (simple moving average) of Agco Corporation AGCO
| SMA period | SMA current | SMA prev | SMA prev2 | | 5 day SMA | 105.59 | 105.55 | 106.74 | | 12 day SMA | 105.12 | 104.86 | 104.8 | | 20 day SMA | 105.34 | 105.39 | 105.37 | | 35 day SMA | 106.13 | 106.17 | 106.22 | | 50 day SMA | 106.57 | 106.6 | 106.69 | | 100 day SMA | 108.61 | 108.62 | 108.65 | | 150 day SMA | 106.71 | 106.57 | 106.44 | | 200 day SMA | 102.35 | 102.33 | 102.32 |
|
|
