AflacIncorporated AFL full analysis,charts,indicators,moving averages,SMA,DMA,EMA,ADX,MACD,RSIAflac Incorporated AFL WideScreen charts, DMA,SMA,EMA technical analysis, forecast prediction, by indicators ADX,MACD,RSI,CCI NYSE stock exchange
operates under Finance sector & deals in Accident Health Insurance
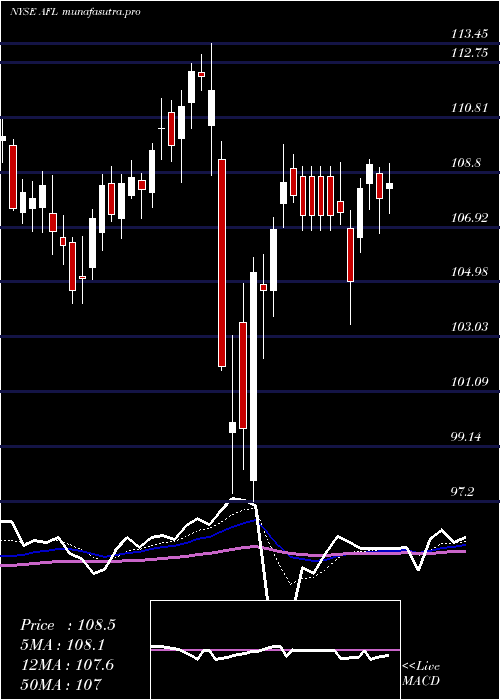
Daily price and charts and targets AflacIncorporated Strong Daily Stock price targets for AflacIncorporated AFL are 109.12 and 110.26 | Daily Target 1 | 108.32 | | Daily Target 2 | 108.78 | | Daily Target 3 | 109.46 | | Daily Target 4 | 109.92 | | Daily Target 5 | 110.6 |
Daily price and volume Aflac Incorporated
| Date |
Closing |
Open |
Range |
Volume |
Thu 04 December 2025 |
109.24 (0.18%) |
109.04 |
109.00 - 110.14 |
0.8948 times |
Wed 03 December 2025 |
109.04 (0.19%) |
108.83 |
108.29 - 109.51 |
0.7025 times |
Tue 02 December 2025 |
108.83 (-0.66%) |
109.59 |
108.55 - 109.79 |
0.6627 times |
Mon 01 December 2025 |
109.55 (-0.69%) |
110.31 |
109.34 - 110.98 |
1.0145 times |
Fri 28 November 2025 |
110.31 (-0.22%) |
110.47 |
110.10 - 111.56 |
0.4654 times |
Wed 26 November 2025 |
110.55 (-0.97%) |
111.46 |
110.54 - 111.62 |
0.745 times |
Tue 25 November 2025 |
111.63 (1.13%) |
111.12 |
110.68 - 112.46 |
0.8512 times |
Mon 24 November 2025 |
110.38 (-0.54%) |
110.89 |
109.42 - 111.00 |
2.7131 times |
Fri 21 November 2025 |
110.98 (0.39%) |
110.99 |
110.46 - 111.75 |
0.984 times |
Thu 20 November 2025 |
110.55 (1.05%) |
109.86 |
109.38 - 110.91 |
0.9668 times |
Wed 19 November 2025 |
109.40 (-2.11%) |
110.82 |
108.31 - 111.15 |
1.0599 times |
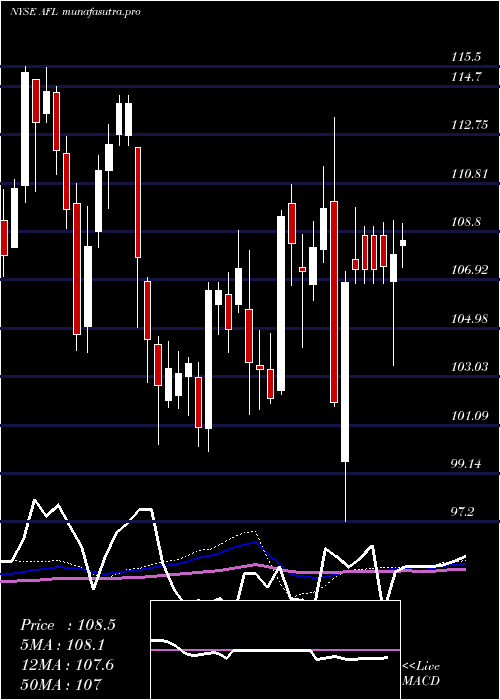
Weekly price and charts AflacIncorporated Strong weekly Stock price targets for AflacIncorporated AFL are 107.42 and 110.11 | Weekly Target 1 | 106.81 | | Weekly Target 2 | 108.03 | | Weekly Target 3 | 109.50333333333 | | Weekly Target 4 | 110.72 | | Weekly Target 5 | 112.19 |
Weekly price and volumes for Aflac Incorporated
| Date |
Closing |
Open |
Range |
Volume |
Thu 04 December 2025 |
109.24 (-0.97%) |
110.31 |
108.29 - 110.98 |
0.899 times |
Fri 28 November 2025 |
110.31 (-0.6%) |
110.89 |
109.42 - 112.46 |
1.3109 times |
Fri 21 November 2025 |
110.98 (-2.94%) |
114.34 |
108.31 - 114.44 |
1.3742 times |
Fri 14 November 2025 |
114.34 (0.22%) |
113.30 |
112.39 - 115.84 |
1.169 times |
Fri 07 November 2025 |
114.09 (6.44%) |
107.87 |
106.87 - 114.78 |
1.1697 times |
Fri 31 October 2025 |
107.19 (0%) |
105.85 |
105.75 - 107.63 |
0.2924 times |
Fri 31 October 2025 |
107.19 (0.01%) |
107.42 |
105.43 - 107.74 |
1.0181 times |
Fri 24 October 2025 |
107.18 (-0.49%) |
107.83 |
106.71 - 109.10 |
0.9293 times |
Fri 17 October 2025 |
107.71 (-2.92%) |
110.57 |
106.46 - 112.00 |
0.9889 times |
Fri 10 October 2025 |
110.95 (-1.22%) |
112.39 |
110.64 - 113.90 |
0.8485 times |
Fri 03 October 2025 |
112.32 (0.86%) |
111.45 |
109.66 - 112.42 |
1.0367 times |
Monthly price and charts AflacIncorporated Strong monthly Stock price targets for AflacIncorporated AFL are 107.42 and 110.11 | Monthly Target 1 | 106.81 | | Monthly Target 2 | 108.03 | | Monthly Target 3 | 109.50333333333 | | Monthly Target 4 | 110.72 | | Monthly Target 5 | 112.19 |
Monthly price and volumes Aflac Incorporated
| Date |
Closing |
Open |
Range |
Volume |
Thu 04 December 2025 |
109.24 (-0.97%) |
110.31 |
108.29 - 110.98 |
0.186 times |
Fri 28 November 2025 |
110.31 (2.91%) |
107.87 |
106.87 - 115.84 |
1.0393 times |
Fri 31 October 2025 |
107.19 (-4.04%) |
111.00 |
105.43 - 113.90 |
0.9464 times |
Tue 30 September 2025 |
111.70 (4.53%) |
106.63 |
104.66 - 111.85 |
1.2489 times |
Fri 29 August 2025 |
106.86 (7.55%) |
99.41 |
96.95 - 109.65 |
1.3328 times |
Thu 31 July 2025 |
99.36 (-5.78%) |
105.20 |
98.05 - 106.48 |
1.0736 times |
Mon 30 June 2025 |
105.46 (1.85%) |
102.67 |
100.21 - 105.58 |
1.2406 times |
Fri 30 May 2025 |
103.54 (-4.73%) |
105.50 |
101.67 - 107.97 |
0.9937 times |
Wed 30 April 2025 |
108.68 (-2.26%) |
111.36 |
97.20 - 113.45 |
1.0212 times |
Mon 31 March 2025 |
111.19 (1.57%) |
110.00 |
104.21 - 111.78 |
0.9175 times |
Fri 28 February 2025 |
109.47 (1.95%) |
105.73 |
101.50 - 109.70 |
0.9343 times |

DMA SMA EMA moving averages of Aflac Incorporated AFL
DMA (daily moving average) of Aflac Incorporated AFL
| DMA period | DMA value | | 5 day DMA | 109.39 | | 12 day DMA | 110.19 | | 20 day DMA | 111.68 | | 35 day DMA | 109.97 | | 50 day DMA | 110.36 | | 100 day DMA | 107.76 | | 150 day DMA | 106.44 | | 200 day DMA | 106.65 | EMA (exponential moving average) of Aflac Incorporated AFL
| EMA period | EMA current | EMA prev | EMA prev2 | | 5 day EMA | 109.46 | 109.57 | 109.84 | | 12 day EMA | 110.16 | 110.33 | 110.57 | | 20 day EMA | 110.4 | 110.52 | 110.68 | | 35 day EMA | 110.52 | 110.6 | 110.69 | | 50 day EMA | 110.09 | 110.12 | 110.16 |
SMA (simple moving average) of Aflac Incorporated AFL
| SMA period | SMA current | SMA prev | SMA prev2 | | 5 day SMA | 109.39 | 109.66 | 110.17 | | 12 day SMA | 110.19 | 110.44 | 110.88 | | 20 day SMA | 111.68 | 111.78 | 111.77 | | 35 day SMA | 109.97 | 109.98 | 110.05 | | 50 day SMA | 110.36 | 110.36 | 110.34 | | 100 day SMA | 107.76 | 107.67 | 107.61 | | 150 day SMA | 106.44 | 106.43 | 106.43 | | 200 day SMA | 106.65 | 106.62 | 106.59 |
|
|
