AmericanFinancial AFGE full analysis,charts,indicators,moving averages,SMA,DMA,EMA,ADX,MACD,RSIAmerican Financial AFGE WideScreen charts, DMA,SMA,EMA technical analysis, forecast prediction, by indicators ADX,MACD,RSI,CCI NYSE stock exchange
operates under Finance sector & deals in Property Casualty Insurers
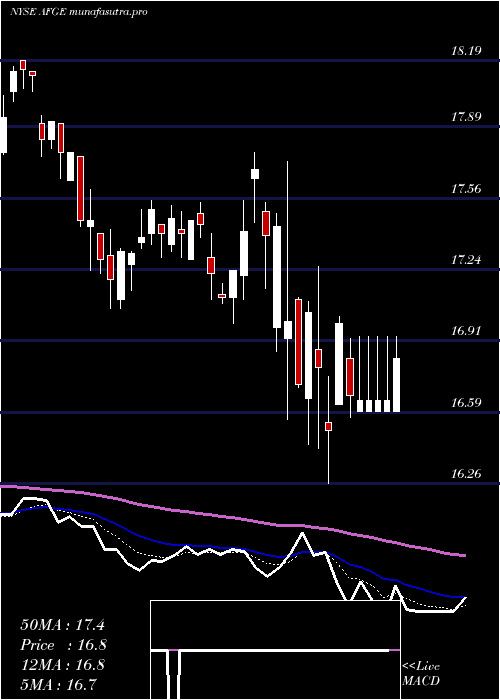
Daily price and charts and targets AmericanFinancial Strong Daily Stock price targets for AmericanFinancial AFGE are 16.89 and 16.91 | Daily Target 1 | 16.89 | | Daily Target 2 | 16.89 | | Daily Target 3 | 16.906666666667 | | Daily Target 4 | 16.91 | | Daily Target 5 | 16.93 |
Daily price and volume American Financial
| Date |
Closing |
Open |
Range |
Volume |
Thu 04 December 2025 |
16.90 (-0.24%) |
16.92 |
16.90 - 16.92 |
0.4283 times |
Wed 03 December 2025 |
16.94 (-0.29%) |
16.87 |
16.87 - 17.00 |
1.3408 times |
Tue 02 December 2025 |
16.99 (-0.06%) |
16.93 |
16.90 - 17.00 |
1.4339 times |
Mon 01 December 2025 |
17.00 (-2.07%) |
17.04 |
16.91 - 17.16 |
1.1732 times |
Fri 28 November 2025 |
17.36 (-0.57%) |
17.45 |
17.35 - 17.50 |
1.9367 times |
Wed 26 November 2025 |
17.46 (-0.11%) |
17.44 |
17.44 - 17.53 |
0.9497 times |
Tue 25 November 2025 |
17.48 (0.69%) |
17.40 |
17.40 - 17.54 |
0.54 times |
Mon 24 November 2025 |
17.36 (0.35%) |
17.30 |
17.30 - 17.44 |
0.4097 times |
Fri 21 November 2025 |
17.30 (0.17%) |
17.23 |
17.23 - 17.34 |
0.5773 times |
Thu 20 November 2025 |
17.27 (-0.75%) |
17.43 |
17.20 - 17.43 |
1.2104 times |
Wed 19 November 2025 |
17.40 (-0.06%) |
17.41 |
17.40 - 17.50 |
0.6145 times |
Weekly price and charts AmericanFinancial Strong weekly Stock price targets for AmericanFinancial AFGE are 16.74 and 17.03 | Weekly Target 1 | 16.69 | | Weekly Target 2 | 16.79 | | Weekly Target 3 | 16.976666666667 | | Weekly Target 4 | 17.08 | | Weekly Target 5 | 17.27 |
Weekly price and volumes for American Financial
| Date |
Closing |
Open |
Range |
Volume |
Thu 04 December 2025 |
16.90 (-2.65%) |
17.04 |
16.87 - 17.16 |
1.0837 times |
Fri 28 November 2025 |
17.36 (0.35%) |
17.30 |
17.30 - 17.54 |
0.95 times |
Fri 21 November 2025 |
17.30 (-2.26%) |
17.63 |
17.20 - 17.64 |
1.3051 times |
Fri 14 November 2025 |
17.70 (-1.28%) |
18.02 |
17.53 - 18.05 |
0.7333 times |
Fri 07 November 2025 |
17.93 (0.5%) |
17.75 |
17.52 - 17.94 |
1.4619 times |
Fri 31 October 2025 |
17.84 (0%) |
18.14 |
17.77 - 18.14 |
0.2444 times |
Fri 31 October 2025 |
17.84 (-1.87%) |
18.06 |
17.77 - 18.25 |
0.7194 times |
Fri 24 October 2025 |
18.18 (0.78%) |
18.04 |
17.90 - 18.29 |
0.6825 times |
Fri 17 October 2025 |
18.04 (-0.72%) |
18.18 |
17.90 - 18.51 |
0.8255 times |
Fri 10 October 2025 |
18.17 (-4.62%) |
19.14 |
17.96 - 19.24 |
1.9942 times |
Fri 03 October 2025 |
19.05 (0.37%) |
18.79 |
18.41 - 19.41 |
1.077 times |
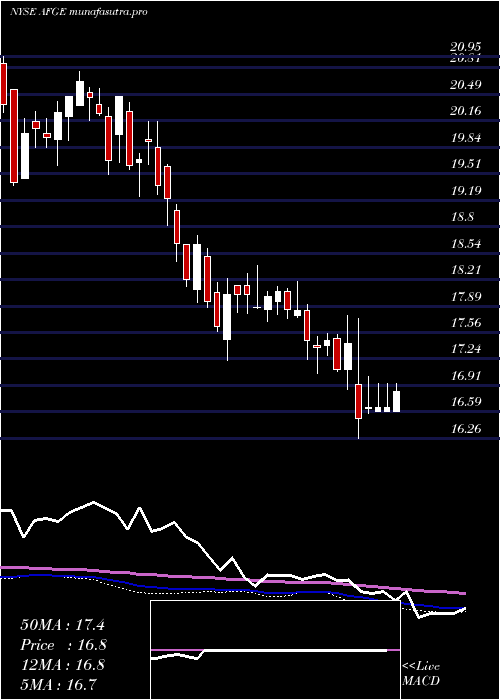
Monthly price and charts AmericanFinancial Strong monthly Stock price targets for AmericanFinancial AFGE are 16.74 and 17.03 | Monthly Target 1 | 16.69 | | Monthly Target 2 | 16.79 | | Monthly Target 3 | 16.976666666667 | | Monthly Target 4 | 17.08 | | Monthly Target 5 | 17.27 |
Monthly price and volumes American Financial
| Date |
Closing |
Open |
Range |
Volume |
Thu 04 December 2025 |
16.90 (-2.65%) |
17.04 |
16.87 - 17.16 |
0.1299 times |
Fri 28 November 2025 |
17.36 (-2.69%) |
17.75 |
17.20 - 18.05 |
0.5333 times |
Fri 31 October 2025 |
17.84 (-5.41%) |
18.66 |
17.77 - 19.24 |
0.625 times |
Tue 30 September 2025 |
18.86 (7.96%) |
17.50 |
17.24 - 19.41 |
1.1578 times |
Fri 29 August 2025 |
17.47 (3.13%) |
16.98 |
16.87 - 18.00 |
1.8492 times |
Thu 31 July 2025 |
16.94 (-0.24%) |
16.94 |
16.74 - 17.44 |
1.0605 times |
Mon 30 June 2025 |
16.98 (5.4%) |
16.13 |
16.12 - 17.02 |
1.0185 times |
Fri 30 May 2025 |
16.11 (-3.82%) |
16.80 |
16.11 - 17.06 |
1.3054 times |
Wed 30 April 2025 |
16.75 (-2.79%) |
17.21 |
16.26 - 17.77 |
1.3027 times |
Mon 31 March 2025 |
17.23 (-3.37%) |
17.83 |
16.99 - 17.91 |
1.0177 times |
Fri 28 February 2025 |
17.83 (-0.22%) |
17.84 |
17.69 - 18.19 |
0.7212 times |

DMA SMA EMA moving averages of American Financial AFGE
DMA (daily moving average) of American Financial AFGE
| DMA period | DMA value | | 5 day DMA | 17.04 | | 12 day DMA | 17.24 | | 20 day DMA | 17.45 | | 35 day DMA | 17.69 | | 50 day DMA | 18.02 | | 100 day DMA | 17.87 | | 150 day DMA | 17.49 | | 200 day DMA | 17.44 | EMA (exponential moving average) of American Financial AFGE
| EMA period | EMA current | EMA prev | EMA prev2 | | 5 day EMA | 17.03 | 17.1 | 17.18 | | 12 day EMA | 17.23 | 17.29 | 17.35 | | 20 day EMA | 17.41 | 17.46 | 17.51 | | 35 day EMA | 17.71 | 17.76 | 17.81 | | 50 day EMA | 18 | 18.05 | 18.1 |
SMA (simple moving average) of American Financial AFGE
| SMA period | SMA current | SMA prev | SMA prev2 | | 5 day SMA | 17.04 | 17.15 | 17.26 | | 12 day SMA | 17.24 | 17.29 | 17.35 | | 20 day SMA | 17.45 | 17.49 | 17.52 | | 35 day SMA | 17.69 | 17.73 | 17.78 | | 50 day SMA | 18.02 | 18.06 | 18.1 | | 100 day SMA | 17.87 | 17.88 | 17.88 | | 150 day SMA | 17.49 | 17.49 | 17.49 | | 200 day SMA | 17.44 | 17.45 | 17.45 |
|
|
