AmericanFinancial AFGD full analysis,charts,indicators,moving averages,SMA,DMA,EMA,ADX,MACD,RSIAmerican Financial AFGD WideScreen charts, DMA,SMA,EMA technical analysis, forecast prediction, by indicators ADX,MACD,RSI,CCI NYSE stock exchange
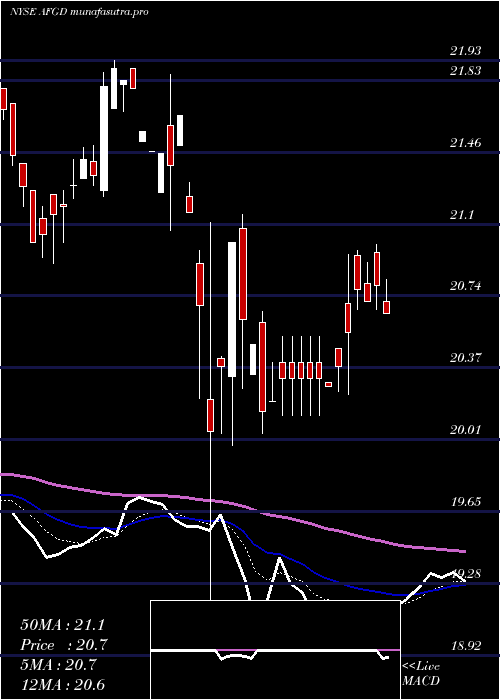
Daily price and charts and targets AmericanFinancial Strong Daily Stock price targets for AmericanFinancial AFGD are 22.05 and 22.25 | Daily Target 1 | 21.88 | | Daily Target 2 | 22.02 | | Daily Target 3 | 22.083333333333 | | Daily Target 4 | 22.22 | | Daily Target 5 | 22.28 |
Daily price and volume American Financial
| Date |
Closing |
Open |
Range |
Volume |
Tue 21 October 2025 |
22.15 (1.23%) |
21.95 |
21.95 - 22.15 |
0.4011 times |
Mon 20 October 2025 |
21.88 (-0.05%) |
21.92 |
21.80 - 21.93 |
0.9169 times |
Fri 17 October 2025 |
21.89 (0.05%) |
21.82 |
21.82 - 21.89 |
1.0888 times |
Thu 16 October 2025 |
21.88 (-0.5%) |
21.80 |
21.80 - 22.20 |
2.4642 times |
Wed 15 October 2025 |
21.99 (-0.32%) |
22.16 |
21.99 - 22.17 |
0.6017 times |
Tue 14 October 2025 |
22.06 (0.18%) |
22.03 |
21.93 - 22.25 |
1.7765 times |
Mon 13 October 2025 |
22.02 (-0.5%) |
22.10 |
22.02 - 22.10 |
0.5158 times |
Fri 10 October 2025 |
22.13 (-0.14%) |
22.13 |
22.13 - 22.13 |
0.3438 times |
Thu 09 October 2025 |
22.16 (-0.31%) |
22.17 |
22.14 - 22.20 |
1.2894 times |
Wed 08 October 2025 |
22.23 (-0.31%) |
22.22 |
22.22 - 22.24 |
0.6017 times |
Tue 07 October 2025 |
22.30 (-0.13%) |
22.26 |
22.24 - 22.45 |
1.9484 times |
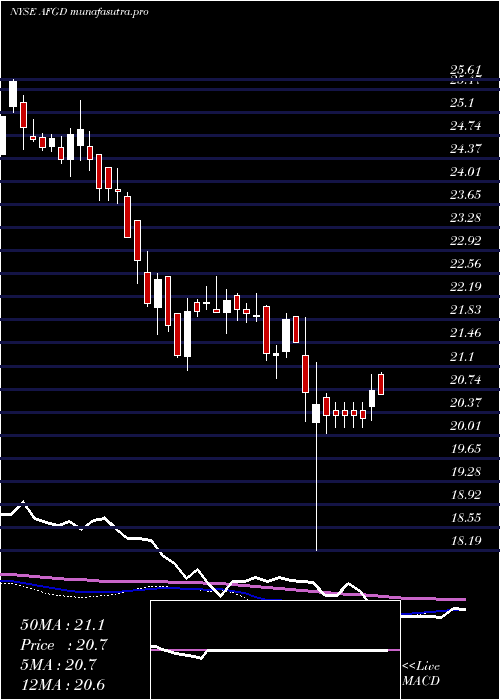
Weekly price and charts AmericanFinancial Strong weekly Stock price targets for AmericanFinancial AFGD are 21.98 and 22.33 | Weekly Target 1 | 21.68 | | Weekly Target 2 | 21.92 | | Weekly Target 3 | 22.033333333333 | | Weekly Target 4 | 22.27 | | Weekly Target 5 | 22.38 |
Weekly price and volumes for American Financial
| Date |
Closing |
Open |
Range |
Volume |
Tue 21 October 2025 |
22.15 (1.19%) |
21.92 |
21.80 - 22.15 |
0.1544 times |
Fri 17 October 2025 |
21.89 (-1.08%) |
22.10 |
21.80 - 22.25 |
0.7555 times |
Fri 10 October 2025 |
22.13 (-0.72%) |
22.36 |
22.13 - 22.45 |
0.609 times |
Fri 03 October 2025 |
22.29 (-0.62%) |
22.38 |
22.03 - 22.60 |
1.3966 times |
Fri 26 September 2025 |
22.43 (-1.1%) |
22.41 |
22.32 - 22.80 |
0.6581 times |
Fri 19 September 2025 |
22.68 (2.81%) |
22.07 |
21.97 - 22.68 |
2.3268 times |
Fri 12 September 2025 |
22.06 (1.33%) |
21.86 |
21.76 - 22.34 |
1.5915 times |
Fri 05 September 2025 |
21.77 (1.54%) |
21.44 |
21.16 - 21.95 |
1.2457 times |
Fri 29 August 2025 |
21.44 (0%) |
21.57 |
21.44 - 21.57 |
0.1343 times |
Fri 29 August 2025 |
21.44 (-0.83%) |
21.62 |
21.33 - 21.63 |
1.1282 times |
Fri 22 August 2025 |
21.62 (2.37%) |
21.10 |
21.10 - 21.84 |
1.2927 times |
Monthly price and charts AmericanFinancial Strong monthly Stock price targets for AmericanFinancial AFGD are 21.63 and 22.32 | Monthly Target 1 | 21.46 | | Monthly Target 2 | 21.8 | | Monthly Target 3 | 22.146666666667 | | Monthly Target 4 | 22.49 | | Monthly Target 5 | 22.84 |
Monthly price and volumes American Financial
| Date |
Closing |
Open |
Range |
Volume |
Tue 21 October 2025 |
22.15 (0.23%) |
22.49 |
21.80 - 22.49 |
0.3125 times |
Tue 30 September 2025 |
22.10 (3.08%) |
21.44 |
21.16 - 22.80 |
1.1869 times |
Fri 29 August 2025 |
21.44 (1.85%) |
21.10 |
20.90 - 21.84 |
0.6931 times |
Thu 31 July 2025 |
21.05 (1.94%) |
20.64 |
20.35 - 21.19 |
0.8816 times |
Mon 30 June 2025 |
20.65 (3.72%) |
20.00 |
19.85 - 20.65 |
0.8746 times |
Fri 30 May 2025 |
19.91 (-2.93%) |
20.45 |
19.74 - 20.99 |
1.214 times |
Wed 30 April 2025 |
20.51 (-4.43%) |
21.60 |
18.19 - 21.86 |
1.2533 times |
Mon 31 March 2025 |
21.46 (-2.01%) |
22.04 |
20.90 - 22.06 |
0.8932 times |
Fri 28 February 2025 |
21.90 (-0.23%) |
21.95 |
21.62 - 22.30 |
1.0452 times |
Fri 31 January 2025 |
21.95 (1.43%) |
21.85 |
21.03 - 22.56 |
1.6455 times |
Tue 31 December 2024 |
21.64 (-9.46%) |
23.89 |
21.59 - 24.22 |
1.7112 times |

DMA SMA EMA moving averages of American Financial AFGD
DMA (daily moving average) of American Financial AFGD
| DMA period | DMA value | | 5 day DMA | 21.96 | | 12 day DMA | 22.09 | | 20 day DMA | 22.2 | | 35 day DMA | 22.17 | | 50 day DMA | 21.94 | | 100 day DMA | 21.31 | | 150 day DMA | 21.07 | | 200 day DMA | 21.26 | EMA (exponential moving average) of American Financial AFGD
| EMA period | EMA current | EMA prev | EMA prev2 | | 5 day EMA | 22.01 | 21.94 | 21.97 | | 12 day EMA | 22.07 | 22.06 | 22.09 | | 20 day EMA | 22.11 | 22.11 | 22.13 | | 35 day EMA | 21.99 | 21.98 | 21.99 | | 50 day EMA | 21.88 | 21.87 | 21.87 |
SMA (simple moving average) of American Financial AFGD
| SMA period | SMA current | SMA prev | SMA prev2 | | 5 day SMA | 21.96 | 21.94 | 21.97 | | 12 day SMA | 22.09 | 22.1 | 22.13 | | 20 day SMA | 22.2 | 22.23 | 22.27 | | 35 day SMA | 22.17 | 22.15 | 22.14 | | 50 day SMA | 21.94 | 21.92 | 21.91 | | 100 day SMA | 21.31 | 21.29 | 21.27 | | 150 day SMA | 21.07 | 21.07 | 21.06 | | 200 day SMA | 21.26 | 21.26 | 21.27 |
|
|
