AmericanFinancial AFGC full analysis,charts,indicators,moving averages,SMA,DMA,EMA,ADX,MACD,RSIAmerican Financial AFGC WideScreen charts, DMA,SMA,EMA technical analysis, forecast prediction, by indicators ADX,MACD,RSI,CCI NYSE stock exchange
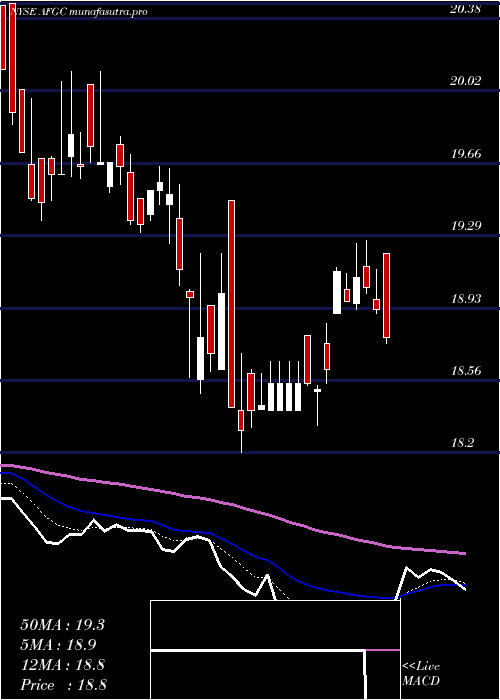
Daily price and charts and targets AmericanFinancial Strong Daily Stock price targets for AmericanFinancial AFGC are 18.94 and 19.13 | Daily Target 1 | 18.8 | | Daily Target 2 | 18.89 | | Daily Target 3 | 18.99 | | Daily Target 4 | 19.08 | | Daily Target 5 | 19.18 |
Daily price and volume American Financial
| Date |
Closing |
Open |
Range |
Volume |
Thu 04 December 2025 |
18.98 (-0.11%) |
18.91 |
18.90 - 19.09 |
0.7989 times |
Wed 03 December 2025 |
19.00 (0.11%) |
19.00 |
18.86 - 19.01 |
0.8845 times |
Tue 02 December 2025 |
18.98 (0.42%) |
19.00 |
18.77 - 19.00 |
0.6705 times |
Mon 01 December 2025 |
18.90 (-1.82%) |
18.99 |
18.85 - 19.08 |
1.1341 times |
Fri 28 November 2025 |
19.25 (-0.16%) |
19.44 |
19.25 - 19.44 |
1.3552 times |
Wed 26 November 2025 |
19.28 (0.16%) |
19.40 |
19.26 - 19.40 |
0.5136 times |
Tue 25 November 2025 |
19.25 (-0.52%) |
19.35 |
19.25 - 19.39 |
2.3966 times |
Mon 24 November 2025 |
19.35 (-0.26%) |
19.40 |
19.35 - 19.57 |
0.7204 times |
Fri 21 November 2025 |
19.40 (0.47%) |
19.22 |
19.22 - 19.40 |
0.2639 times |
Thu 20 November 2025 |
19.31 (-1.08%) |
19.53 |
19.22 - 19.68 |
1.2625 times |
Wed 19 November 2025 |
19.52 (-0.36%) |
19.57 |
19.50 - 19.61 |
0.3138 times |
Weekly price and charts AmericanFinancial Strong weekly Stock price targets for AmericanFinancial AFGC are 18.72 and 19.04 | Weekly Target 1 | 18.63 | | Weekly Target 2 | 18.8 | | Weekly Target 3 | 18.946666666667 | | Weekly Target 4 | 19.12 | | Weekly Target 5 | 19.27 |
Weekly price and volumes for American Financial
| Date |
Closing |
Open |
Range |
Volume |
Thu 04 December 2025 |
18.98 (-1.4%) |
18.99 |
18.77 - 19.09 |
0.9611 times |
Fri 28 November 2025 |
19.25 (-0.77%) |
19.40 |
19.25 - 19.57 |
1.3739 times |
Fri 21 November 2025 |
19.40 (-1.72%) |
19.74 |
19.22 - 19.95 |
0.7508 times |
Fri 14 November 2025 |
19.74 (-1.74%) |
20.16 |
19.72 - 20.28 |
0.7547 times |
Fri 07 November 2025 |
20.09 (-0.1%) |
19.91 |
19.72 - 20.22 |
0.8707 times |
Fri 31 October 2025 |
20.11 (0%) |
20.20 |
20.02 - 20.20 |
0.116 times |
Fri 31 October 2025 |
20.11 (0.9%) |
20.00 |
20.00 - 20.34 |
0.9198 times |
Fri 24 October 2025 |
19.93 (1.17%) |
19.72 |
19.72 - 20.10 |
0.9867 times |
Fri 17 October 2025 |
19.70 (-1.5%) |
19.83 |
19.54 - 20.25 |
2.5826 times |
Fri 10 October 2025 |
20.00 (-2.77%) |
20.70 |
20.00 - 20.70 |
0.6836 times |
Fri 03 October 2025 |
20.57 (0.24%) |
20.65 |
20.42 - 20.68 |
0.562 times |
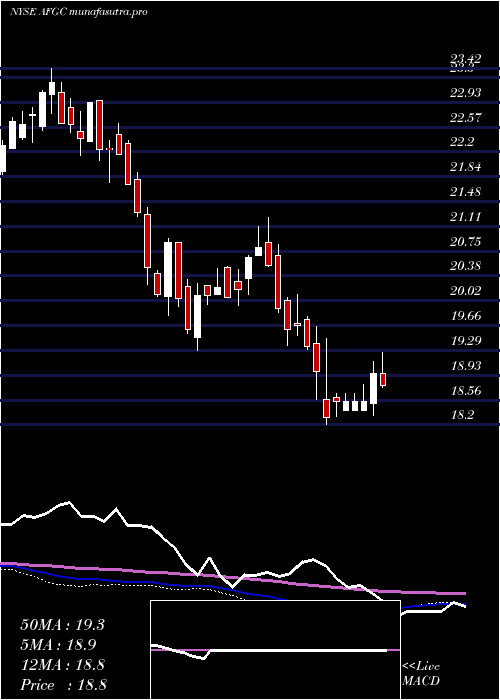
Monthly price and charts AmericanFinancial Strong monthly Stock price targets for AmericanFinancial AFGC are 18.72 and 19.04 | Monthly Target 1 | 18.63 | | Monthly Target 2 | 18.8 | | Monthly Target 3 | 18.946666666667 | | Monthly Target 4 | 19.12 | | Monthly Target 5 | 19.27 |
Monthly price and volumes American Financial
| Date |
Closing |
Open |
Range |
Volume |
Thu 04 December 2025 |
18.98 (-1.4%) |
18.99 |
18.77 - 19.09 |
0.2362 times |
Fri 28 November 2025 |
19.25 (-4.28%) |
19.91 |
19.22 - 20.28 |
0.9215 times |
Fri 31 October 2025 |
20.11 (-1.85%) |
20.47 |
19.54 - 20.70 |
1.3821 times |
Tue 30 September 2025 |
20.49 (6.06%) |
19.14 |
19.14 - 20.80 |
1.4701 times |
Fri 29 August 2025 |
19.32 (2.49%) |
18.89 |
18.80 - 19.93 |
1.6773 times |
Thu 31 July 2025 |
18.85 (-0.79%) |
18.99 |
18.78 - 19.49 |
1.3505 times |
Mon 30 June 2025 |
19.00 (5.2%) |
18.10 |
18.01 - 19.16 |
0.8003 times |
Fri 30 May 2025 |
18.06 (-4.55%) |
19.20 |
18.05 - 19.30 |
0.8751 times |
Wed 30 April 2025 |
18.92 (-3.07%) |
19.52 |
18.20 - 19.64 |
0.7301 times |
Mon 31 March 2025 |
19.52 (-4.97%) |
20.68 |
19.31 - 20.85 |
0.5567 times |
Fri 28 February 2025 |
20.54 (2.34%) |
20.31 |
19.95 - 21.24 |
0.9249 times |
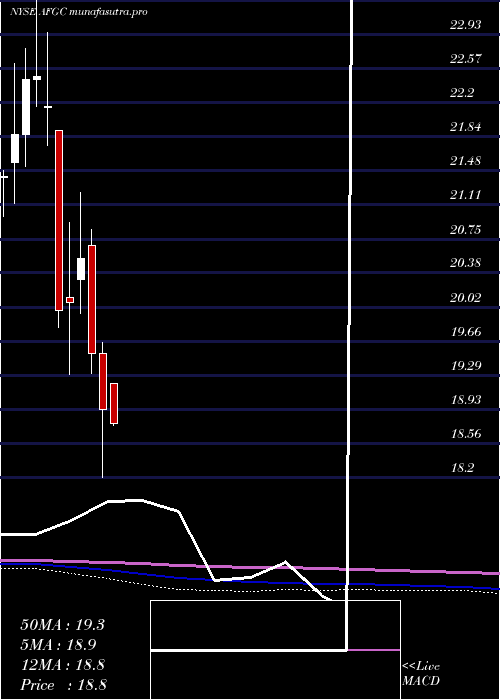
DMA SMA EMA moving averages of American Financial AFGC
DMA (daily moving average) of American Financial AFGC
| DMA period | DMA value | | 5 day DMA | 19.02 | | 12 day DMA | 19.23 | | 20 day DMA | 19.53 | | 35 day DMA | 19.73 | | 50 day DMA | 19.91 | | 100 day DMA | 19.75 | | 150 day DMA | 19.42 | | 200 day DMA | 19.44 | EMA (exponential moving average) of American Financial AFGC
| EMA period | EMA current | EMA prev | EMA prev2 | | 5 day EMA | 19.04 | 19.07 | 19.11 | | 12 day EMA | 19.24 | 19.29 | 19.34 | | 20 day EMA | 19.43 | 19.48 | 19.53 | | 35 day EMA | 19.66 | 19.7 | 19.74 | | 50 day EMA | 19.88 | 19.92 | 19.96 |
SMA (simple moving average) of American Financial AFGC
| SMA period | SMA current | SMA prev | SMA prev2 | | 5 day SMA | 19.02 | 19.08 | 19.13 | | 12 day SMA | 19.23 | 19.3 | 19.36 | | 20 day SMA | 19.53 | 19.58 | 19.63 | | 35 day SMA | 19.73 | 19.76 | 19.78 | | 50 day SMA | 19.91 | 19.95 | 19.98 | | 100 day SMA | 19.75 | 19.75 | 19.75 | | 150 day SMA | 19.42 | 19.42 | 19.42 | | 200 day SMA | 19.44 | 19.45 | 19.45 |
|
|
