AmericanFinancial AFGB full analysis,charts,indicators,moving averages,SMA,DMA,EMA,ADX,MACD,RSIAmerican Financial AFGB WideScreen charts, DMA,SMA,EMA technical analysis, forecast prediction, by indicators ADX,MACD,RSI,CCI NYSE stock exchange
Daily price and charts and targets AmericanFinancial Strong Daily Stock price targets for AmericanFinancial AFGB are 21.74 and 21.93 | Daily Target 1 | 21.7 | | Daily Target 2 | 21.77 | | Daily Target 3 | 21.886666666667 | | Daily Target 4 | 21.96 | | Daily Target 5 | 22.08 |
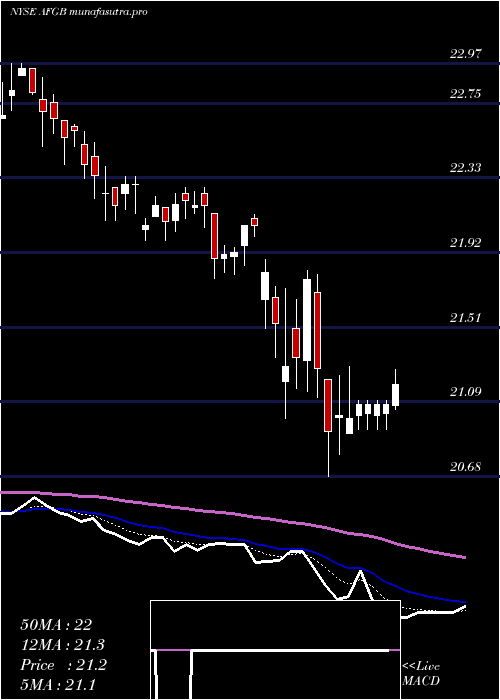
Daily price and volume American Financial
| Date |
Closing |
Open |
Range |
Volume |
Fri 05 December 2025 |
21.85 (0.09%) |
21.88 |
21.81 - 22.00 |
0.8591 times |
Thu 04 December 2025 |
21.83 (-0.32%) |
21.91 |
21.82 - 21.95 |
1.512 times |
Wed 03 December 2025 |
21.90 (0.37%) |
21.82 |
21.80 - 21.90 |
0.9622 times |
Tue 02 December 2025 |
21.82 (-0.05%) |
21.95 |
21.73 - 22.01 |
0.8763 times |
Mon 01 December 2025 |
21.83 (-0.32%) |
21.85 |
21.64 - 22.00 |
0.7818 times |
Fri 28 November 2025 |
21.90 (-0.41%) |
21.86 |
21.82 - 22.06 |
0.6443 times |
Wed 26 November 2025 |
21.99 (0.32%) |
21.82 |
21.78 - 22.27 |
0.8763 times |
Tue 25 November 2025 |
21.92 (-0.81%) |
22.08 |
21.73 - 22.25 |
2.1821 times |
Mon 24 November 2025 |
22.10 (0%) |
22.01 |
22.01 - 22.16 |
0.5584 times |
Fri 21 November 2025 |
22.10 (0.18%) |
21.91 |
21.91 - 22.10 |
0.7474 times |
Thu 20 November 2025 |
22.06 (-0.32%) |
22.17 |
21.91 - 22.18 |
1.177 times |
Weekly price and charts AmericanFinancial Strong weekly Stock price targets for AmericanFinancial AFGB are 21.67 and 22.04 | Weekly Target 1 | 21.46 | | Weekly Target 2 | 21.66 | | Weekly Target 3 | 21.833333333333 | | Weekly Target 4 | 22.03 | | Weekly Target 5 | 22.2 |
Weekly price and volumes for American Financial
| Date |
Closing |
Open |
Range |
Volume |
Fri 05 December 2025 |
21.85 (-0.23%) |
21.85 |
21.64 - 22.01 |
1.7603 times |
Fri 28 November 2025 |
21.90 (-0.9%) |
22.01 |
21.73 - 22.27 |
1.5028 times |
Fri 21 November 2025 |
22.10 (-0.9%) |
22.20 |
21.91 - 22.27 |
1.2513 times |
Fri 14 November 2025 |
22.30 (-0.76%) |
22.62 |
22.13 - 22.62 |
1.0089 times |
Fri 07 November 2025 |
22.47 (-0.84%) |
22.39 |
22.39 - 22.80 |
1.0847 times |
Fri 31 October 2025 |
22.66 (0%) |
22.80 |
22.66 - 22.80 |
0.1454 times |
Fri 31 October 2025 |
22.66 (-0.04%) |
22.67 |
22.60 - 22.91 |
0.918 times |
Fri 24 October 2025 |
22.67 (0.89%) |
22.46 |
22.45 - 22.82 |
0.8817 times |
Fri 17 October 2025 |
22.47 (-0.79%) |
23.07 |
22.38 - 23.07 |
0.7181 times |
Fri 10 October 2025 |
22.65 (-1.86%) |
22.91 |
22.65 - 23.14 |
0.7289 times |
Fri 03 October 2025 |
23.08 (-0.73%) |
23.29 |
22.91 - 23.40 |
1.8683 times |

Monthly price and charts AmericanFinancial Strong monthly Stock price targets for AmericanFinancial AFGB are 21.67 and 22.04 | Monthly Target 1 | 21.46 | | Monthly Target 2 | 21.66 | | Monthly Target 3 | 21.833333333333 | | Monthly Target 4 | 22.03 | | Monthly Target 5 | 22.2 |
Monthly price and volumes American Financial
| Date |
Closing |
Open |
Range |
Volume |
Fri 05 December 2025 |
21.85 (-0.23%) |
21.85 |
21.64 - 22.01 |
0.3057 times |
Fri 28 November 2025 |
21.90 (-3.35%) |
22.39 |
21.73 - 22.80 |
0.8418 times |
Fri 31 October 2025 |
22.66 (-1.52%) |
23.02 |
22.38 - 23.16 |
0.7199 times |
Tue 30 September 2025 |
23.01 (3%) |
22.45 |
21.94 - 23.47 |
1.1538 times |
Fri 29 August 2025 |
22.34 (3.81%) |
21.57 |
21.44 - 22.55 |
1.0017 times |
Thu 31 July 2025 |
21.52 (0.94%) |
21.32 |
21.16 - 21.76 |
1.119 times |
Mon 30 June 2025 |
21.32 (1.72%) |
20.98 |
20.48 - 21.37 |
0.9381 times |
Fri 30 May 2025 |
20.96 (-2.28%) |
21.33 |
20.79 - 21.57 |
1.1964 times |
Wed 30 April 2025 |
21.45 (-2.14%) |
21.96 |
20.68 - 22.13 |
1.4039 times |
Mon 31 March 2025 |
21.92 (-3.44%) |
22.75 |
21.78 - 22.80 |
1.3198 times |
Fri 28 February 2025 |
22.70 (-0.48%) |
22.79 |
22.41 - 22.97 |
1.0812 times |

DMA SMA EMA moving averages of American Financial AFGB
DMA (daily moving average) of American Financial AFGB
| DMA period | DMA value | | 5 day DMA | 21.85 | | 12 day DMA | 21.95 | | 20 day DMA | 22.11 | | 35 day DMA | 22.34 | | 50 day DMA | 22.52 | | 100 day DMA | 22.39 | | 150 day DMA | 21.99 | | 200 day DMA | 21.97 | EMA (exponential moving average) of American Financial AFGB
| EMA period | EMA current | EMA prev | EMA prev2 | | 5 day EMA | 21.87 | 21.88 | 21.9 | | 12 day EMA | 21.97 | 21.99 | 22.02 | | 20 day EMA | 22.09 | 22.11 | 22.14 | | 35 day EMA | 22.3 | 22.33 | 22.36 | | 50 day EMA | 22.51 | 22.54 | 22.57 |
SMA (simple moving average) of American Financial AFGB
| SMA period | SMA current | SMA prev | SMA prev2 | | 5 day SMA | 21.85 | 21.86 | 21.89 | | 12 day SMA | 21.95 | 21.98 | 22 | | 20 day SMA | 22.11 | 22.14 | 22.18 | | 35 day SMA | 22.34 | 22.36 | 22.39 | | 50 day SMA | 22.52 | 22.55 | 22.58 | | 100 day SMA | 22.39 | 22.38 | 22.38 | | 150 day SMA | 21.99 | 21.99 | 21.99 | | 200 day SMA | 21.97 | 21.97 | 21.98 |
|
|
