AmerenCorporation AEE full analysis,charts,indicators,moving averages,SMA,DMA,EMA,ADX,MACD,RSIAmeren Corporation AEE WideScreen charts, DMA,SMA,EMA technical analysis, forecast prediction, by indicators ADX,MACD,RSI,CCI NYSE stock exchange
operates under Public Utilities sector & deals in Power Generation
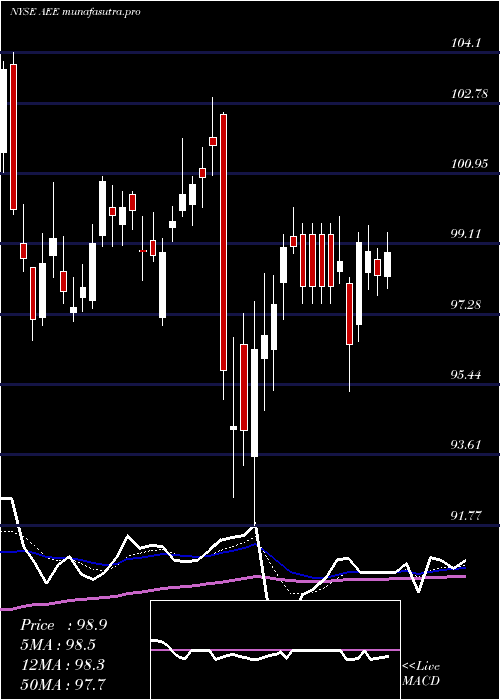
Daily price and charts and targets AmerenCorporation Strong Daily Stock price targets for AmerenCorporation AEE are 103.86 and 105.55 | Daily Target 1 | 103.5 | | Daily Target 2 | 104.21 | | Daily Target 3 | 105.19 | | Daily Target 4 | 105.9 | | Daily Target 5 | 106.88 |
Daily price and volume Ameren Corporation
| Date |
Closing |
Open |
Range |
Volume |
Tue 21 October 2025 |
104.92 (-0.73%) |
106.01 |
104.48 - 106.17 |
0.4844 times |
Mon 20 October 2025 |
105.69 (0.16%) |
106.16 |
105.35 - 106.73 |
1.2065 times |
Fri 17 October 2025 |
105.52 (0.29%) |
105.34 |
104.64 - 105.82 |
0.6668 times |
Thu 16 October 2025 |
105.21 (-0.17%) |
105.60 |
104.70 - 106.23 |
1.137 times |
Wed 15 October 2025 |
105.39 (1.11%) |
104.40 |
103.99 - 105.63 |
1.2798 times |
Tue 14 October 2025 |
104.23 (0.65%) |
103.85 |
103.59 - 104.77 |
0.8992 times |
Mon 13 October 2025 |
103.56 (-0.11%) |
103.53 |
103.26 - 104.53 |
0.8829 times |
Fri 10 October 2025 |
103.67 (0.65%) |
103.23 |
102.98 - 104.85 |
1.1421 times |
Thu 09 October 2025 |
103.00 (-0.68%) |
104.00 |
102.96 - 104.19 |
1.1785 times |
Wed 08 October 2025 |
103.70 (-0.87%) |
104.92 |
103.22 - 104.92 |
1.1227 times |
Tue 07 October 2025 |
104.61 (-0.26%) |
105.17 |
104.30 - 105.67 |
1.2044 times |
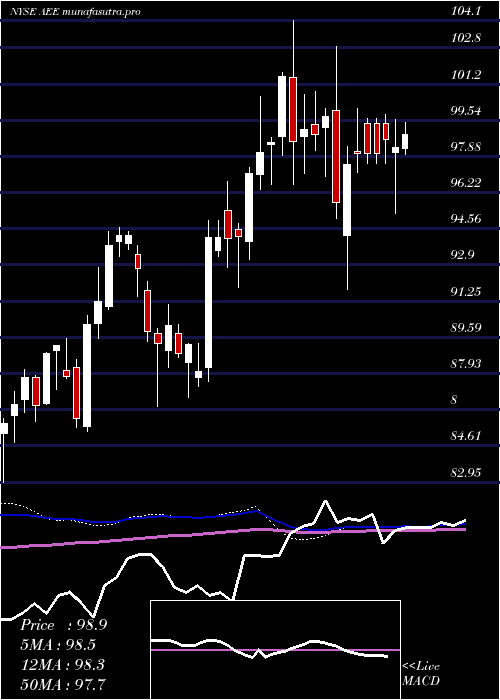
Weekly price and charts AmerenCorporation Strong weekly Stock price targets for AmerenCorporation AEE are 103.58 and 105.83 | Weekly Target 1 | 103.13 | | Weekly Target 2 | 104.02 | | Weekly Target 3 | 105.37666666667 | | Weekly Target 4 | 106.27 | | Weekly Target 5 | 107.63 |
Weekly price and volumes for Ameren Corporation
| Date |
Closing |
Open |
Range |
Volume |
Tue 21 October 2025 |
104.92 (-0.57%) |
106.16 |
104.48 - 106.73 |
0.4796 times |
Fri 17 October 2025 |
105.52 (1.78%) |
103.53 |
103.26 - 106.23 |
1.3799 times |
Fri 10 October 2025 |
103.67 (-0.07%) |
104.09 |
102.96 - 105.79 |
1.5457 times |
Fri 03 October 2025 |
103.74 (1.61%) |
102.28 |
101.74 - 104.52 |
1.3742 times |
Fri 26 September 2025 |
102.10 (3%) |
99.19 |
98.64 - 102.47 |
1.0383 times |
Fri 19 September 2025 |
99.13 (-1.65%) |
100.67 |
97.90 - 101.04 |
1.034 times |
Fri 12 September 2025 |
100.79 (0.16%) |
100.21 |
98.71 - 101.04 |
1.1071 times |
Fri 05 September 2025 |
100.63 (0.85%) |
99.63 |
98.91 - 101.17 |
0.8896 times |
Fri 29 August 2025 |
99.78 (0%) |
99.74 |
99.63 - 100.19 |
0.1522 times |
Fri 29 August 2025 |
99.78 (-2.13%) |
101.64 |
99.43 - 101.83 |
0.9995 times |
Fri 22 August 2025 |
101.95 (1.38%) |
100.56 |
99.85 - 103.41 |
1.1261 times |
Monthly price and charts AmerenCorporation Strong monthly Stock price targets for AmerenCorporation AEE are 103.71 and 107.94 | Monthly Target 1 | 100.49 | | Monthly Target 2 | 102.7 | | Monthly Target 3 | 104.71666666667 | | Monthly Target 4 | 106.93 | | Monthly Target 5 | 108.95 |
Monthly price and volumes Ameren Corporation
| Date |
Closing |
Open |
Range |
Volume |
Tue 21 October 2025 |
104.92 (0.52%) |
104.05 |
102.50 - 106.73 |
0.8286 times |
Tue 30 September 2025 |
104.38 (4.61%) |
99.63 |
97.90 - 104.50 |
0.8878 times |
Fri 29 August 2025 |
99.78 (-1.33%) |
102.54 |
99.43 - 103.54 |
0.8853 times |
Thu 31 July 2025 |
101.13 (5.3%) |
96.10 |
94.20 - 101.58 |
0.9944 times |
Mon 30 June 2025 |
96.04 (-0.87%) |
96.35 |
93.50 - 97.76 |
1.05 times |
Fri 30 May 2025 |
96.88 (-2.38%) |
98.89 |
93.27 - 100.14 |
1.0708 times |
Wed 30 April 2025 |
99.24 (-1.16%) |
100.13 |
91.77 - 102.94 |
1.0653 times |
Mon 31 March 2025 |
100.40 (-1.14%) |
101.49 |
96.59 - 104.10 |
1.2007 times |
Fri 28 February 2025 |
101.56 (7.81%) |
93.96 |
93.16 - 101.75 |
1.204 times |
Fri 31 January 2025 |
94.20 (5.68%) |
89.96 |
86.81 - 96.74 |
0.813 times |
Tue 31 December 2024 |
89.14 (-5.44%) |
93.38 |
86.42 - 93.78 |
0.6664 times |

DMA SMA EMA moving averages of Ameren Corporation AEE
DMA (daily moving average) of Ameren Corporation AEE
| DMA period | DMA value | | 5 day DMA | 105.35 | | 12 day DMA | 104.53 | | 20 day DMA | 103.81 | | 35 day DMA | 102.08 | | 50 day DMA | 101.72 | | 100 day DMA | 99.63 | | 150 day DMA | 99.1 | | 200 day DMA | 98.28 | EMA (exponential moving average) of Ameren Corporation AEE
| EMA period | EMA current | EMA prev | EMA prev2 | | 5 day EMA | 105.09 | 105.18 | 104.93 | | 12 day EMA | 104.47 | 104.39 | 104.15 | | 20 day EMA | 103.77 | 103.65 | 103.44 | | 35 day EMA | 103 | 102.89 | 102.72 | | 50 day EMA | 102.07 | 101.95 | 101.8 |
SMA (simple moving average) of Ameren Corporation AEE
| SMA period | SMA current | SMA prev | SMA prev2 | | 5 day SMA | 105.35 | 105.21 | 104.78 | | 12 day SMA | 104.53 | 104.43 | 104.2 | | 20 day SMA | 103.81 | 103.61 | 103.28 | | 35 day SMA | 102.08 | 101.94 | 101.77 | | 50 day SMA | 101.72 | 101.64 | 101.56 | | 100 day SMA | 99.63 | 99.53 | 99.44 | | 150 day SMA | 99.1 | 99.07 | 99.03 | | 200 day SMA | 98.28 | 98.2 | 98.11 |
|
|
