AgreeRealty ADC full analysis,charts,indicators,moving averages,SMA,DMA,EMA,ADX,MACD,RSIAgree Realty ADC WideScreen charts, DMA,SMA,EMA technical analysis, forecast prediction, by indicators ADX,MACD,RSI,CCI NYSE stock exchange
operates under Consumer Services sector & deals in Real Estate Investment Trusts
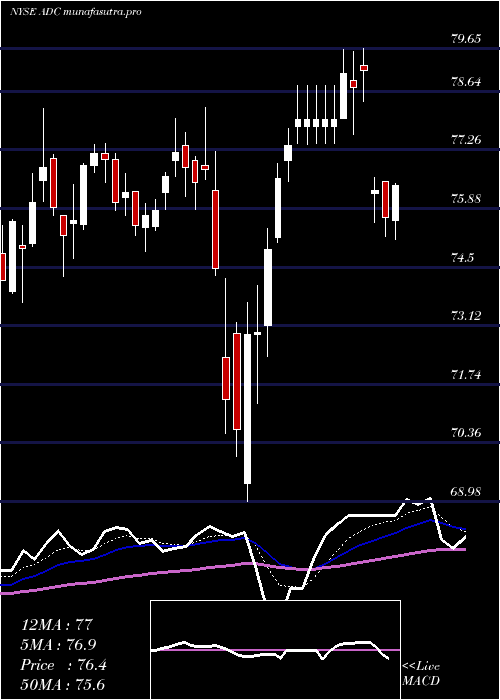
Daily price and charts and targets AgreeRealty Strong Daily Stock price targets for AgreeRealty ADC are 73.49 and 74.26 | Daily Target 1 | 73.35 | | Daily Target 2 | 73.62 | | Daily Target 3 | 74.116666666667 | | Daily Target 4 | 74.39 | | Daily Target 5 | 74.89 |
Daily price and volume Agree Realty
| Date |
Closing |
Open |
Range |
Volume |
Fri 05 December 2025 |
73.90 (-0.65%) |
74.31 |
73.84 - 74.61 |
0.9178 times |
Thu 04 December 2025 |
74.38 (-0.12%) |
74.28 |
74.28 - 75.08 |
0.6218 times |
Wed 03 December 2025 |
74.47 (0.43%) |
74.32 |
74.07 - 74.96 |
0.9027 times |
Tue 02 December 2025 |
74.15 (-0.66%) |
74.82 |
73.93 - 74.83 |
0.675 times |
Mon 01 December 2025 |
74.64 (-0.77%) |
74.77 |
74.36 - 75.25 |
1.0553 times |
Fri 28 November 2025 |
75.22 (0.11%) |
75.00 |
74.65 - 75.43 |
0.4244 times |
Wed 26 November 2025 |
75.14 (0.05%) |
75.00 |
75.00 - 75.68 |
1.153 times |
Tue 25 November 2025 |
75.10 (1.04%) |
74.64 |
74.50 - 75.22 |
1.7261 times |
Mon 24 November 2025 |
74.33 (-0.27%) |
74.53 |
73.87 - 74.58 |
1.215 times |
Fri 21 November 2025 |
74.53 (1.14%) |
73.86 |
73.26 - 74.85 |
1.3089 times |
Thu 20 November 2025 |
73.69 (0.6%) |
73.37 |
72.99 - 73.72 |
1.177 times |
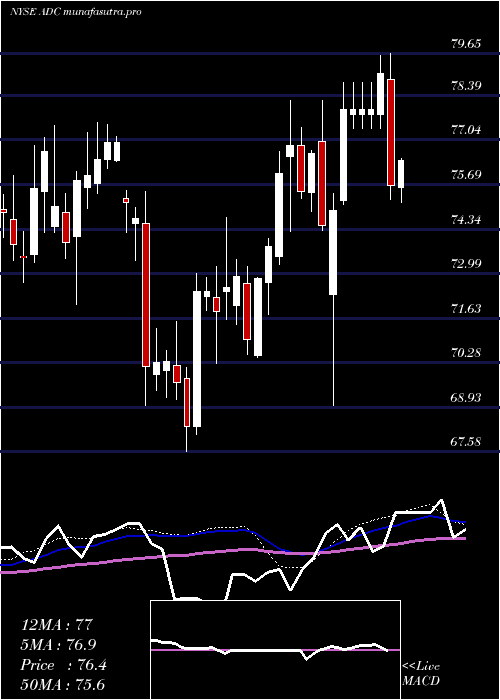
Weekly price and charts AgreeRealty Strong weekly Stock price targets for AgreeRealty ADC are 73.17 and 74.58 | Weekly Target 1 | 72.92 | | Weekly Target 2 | 73.41 | | Weekly Target 3 | 74.33 | | Weekly Target 4 | 74.82 | | Weekly Target 5 | 75.74 |
Weekly price and volumes for Agree Realty
| Date |
Closing |
Open |
Range |
Volume |
Fri 05 December 2025 |
73.90 (-1.75%) |
74.77 |
73.84 - 75.25 |
0.78 times |
Fri 28 November 2025 |
75.22 (0.93%) |
74.53 |
73.87 - 75.68 |
0.8446 times |
Fri 21 November 2025 |
74.53 (1.02%) |
74.11 |
72.67 - 74.85 |
1.1163 times |
Fri 14 November 2025 |
73.78 (0.5%) |
73.27 |
72.82 - 74.33 |
0.9911 times |
Fri 07 November 2025 |
73.41 (0.55%) |
73.31 |
71.65 - 73.52 |
0.9051 times |
Fri 31 October 2025 |
73.01 (0%) |
72.15 |
71.85 - 73.12 |
0.2252 times |
Fri 31 October 2025 |
73.01 (-2.39%) |
74.59 |
71.85 - 75.04 |
1.1306 times |
Fri 24 October 2025 |
74.80 (-0.35%) |
75.42 |
74.42 - 76.79 |
1.4628 times |
Fri 17 October 2025 |
75.06 (4.11%) |
71.70 |
71.63 - 75.23 |
1.4678 times |
Fri 10 October 2025 |
72.10 (2.17%) |
70.95 |
69.76 - 72.14 |
1.0765 times |
Fri 03 October 2025 |
70.57 (-0.97%) |
71.46 |
70.43 - 72.02 |
0.9278 times |
Monthly price and charts AgreeRealty Strong monthly Stock price targets for AgreeRealty ADC are 73.17 and 74.58 | Monthly Target 1 | 72.92 | | Monthly Target 2 | 73.41 | | Monthly Target 3 | 74.33 | | Monthly Target 4 | 74.82 | | Monthly Target 5 | 75.74 |
Monthly price and volumes Agree Realty
| Date |
Closing |
Open |
Range |
Volume |
Fri 05 December 2025 |
73.90 (-1.75%) |
74.77 |
73.84 - 75.25 |
0.1641 times |
Fri 28 November 2025 |
75.22 (3.03%) |
73.31 |
71.65 - 75.68 |
0.8114 times |
Fri 31 October 2025 |
73.01 (2.77%) |
71.48 |
69.76 - 76.79 |
1.2471 times |
Tue 30 September 2025 |
71.04 (-2.34%) |
72.62 |
70.37 - 74.08 |
0.8267 times |
Fri 29 August 2025 |
72.74 (1.45%) |
74.33 |
71.91 - 75.13 |
0.9281 times |
Thu 31 July 2025 |
71.70 (-1.86%) |
72.81 |
70.45 - 74.43 |
1.1468 times |
Mon 30 June 2025 |
73.06 (-2.97%) |
74.86 |
71.59 - 76.21 |
0.9389 times |
Fri 30 May 2025 |
75.30 (-2.98%) |
77.33 |
72.00 - 77.48 |
1.1754 times |
Wed 30 April 2025 |
77.61 (0.54%) |
77.35 |
68.98 - 79.65 |
1.4814 times |
Mon 31 March 2025 |
77.19 (4.59%) |
73.50 |
73.27 - 78.24 |
1.2799 times |
Fri 28 February 2025 |
73.80 (1.69%) |
72.02 |
70.43 - 74.06 |
0.8031 times |

DMA SMA EMA moving averages of Agree Realty ADC
DMA (daily moving average) of Agree Realty ADC
| DMA period | DMA value | | 5 day DMA | 74.31 | | 12 day DMA | 74.4 | | 20 day DMA | 74.1 | | 35 day DMA | 74.03 | | 50 day DMA | 73.3 | | 100 day DMA | 72.95 | | 150 day DMA | 73.32 | | 200 day DMA | 73.95 | EMA (exponential moving average) of Agree Realty ADC
| EMA period | EMA current | EMA prev | EMA prev2 | | 5 day EMA | 74.29 | 74.48 | 74.53 | | 12 day EMA | 74.29 | 74.36 | 74.36 | | 20 day EMA | 74.12 | 74.14 | 74.11 | | 35 day EMA | 73.67 | 73.66 | 73.62 | | 50 day EMA | 73.2 | 73.17 | 73.12 |
SMA (simple moving average) of Agree Realty ADC
| SMA period | SMA current | SMA prev | SMA prev2 | | 5 day SMA | 74.31 | 74.57 | 74.72 | | 12 day SMA | 74.4 | 74.4 | 74.35 | | 20 day SMA | 74.1 | 74.03 | 73.93 | | 35 day SMA | 74.03 | 74.05 | 74.03 | | 50 day SMA | 73.3 | 73.23 | 73.16 | | 100 day SMA | 72.95 | 72.94 | 72.91 | | 150 day SMA | 73.32 | 73.34 | 73.36 | | 200 day SMA | 73.95 | 73.93 | 73.92 |
|
|
