AccenturePlc ACN full analysis,charts,indicators,moving averages,SMA,DMA,EMA,ADX,MACD,RSIAccenture Plc ACN WideScreen charts, DMA,SMA,EMA technical analysis, forecast prediction, by indicators ADX,MACD,RSI,CCI NYSE stock exchange
operates under Miscellaneous sector & deals in Business Services
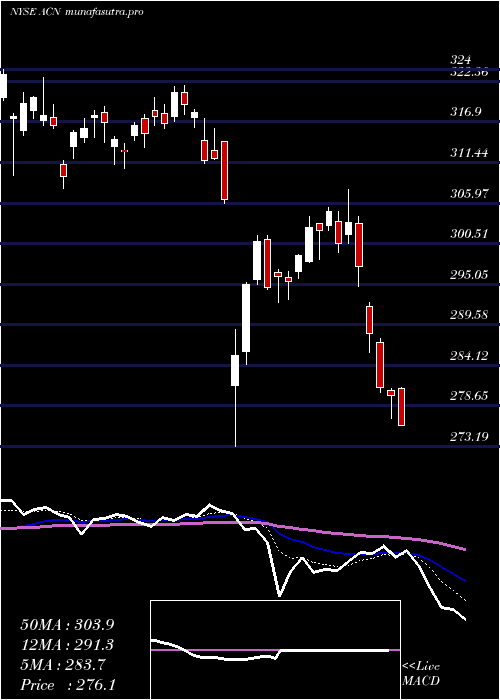
Daily price and charts and targets AccenturePlc Strong Daily Stock price targets for AccenturePlc ACN are 263.87 and 268.8 | Daily Target 1 | 262.96 | | Daily Target 2 | 264.77 | | Daily Target 3 | 267.88666666667 | | Daily Target 4 | 269.7 | | Daily Target 5 | 272.82 |
Daily price and volume Accenture Plc
| Date |
Closing |
Open |
Range |
Volume |
Fri 05 December 2025 |
266.59 (-1.02%) |
268.10 |
266.07 - 271.00 |
1.0572 times |
Thu 04 December 2025 |
269.34 (-1.29%) |
276.30 |
269.17 - 280.71 |
1.1506 times |
Wed 03 December 2025 |
272.85 (4.52%) |
261.98 |
261.75 - 274.06 |
1.9444 times |
Tue 02 December 2025 |
261.04 (1.4%) |
257.47 |
257.00 - 262.96 |
0.6806 times |
Mon 01 December 2025 |
257.43 (2.97%) |
253.13 |
251.02 - 258.90 |
1.4034 times |
Fri 28 November 2025 |
250.00 (0.87%) |
247.49 |
245.13 - 251.45 |
0.4172 times |
Wed 26 November 2025 |
247.85 (-0.57%) |
250.28 |
246.89 - 251.94 |
0.6673 times |
Tue 25 November 2025 |
249.28 (2.31%) |
243.77 |
243.60 - 251.68 |
0.5007 times |
Mon 24 November 2025 |
243.64 (-3.26%) |
252.57 |
243.24 - 253.00 |
0.5142 times |
Fri 21 November 2025 |
251.85 (4.59%) |
241.88 |
241.29 - 253.97 |
1.6644 times |
Thu 20 November 2025 |
240.79 (-0.12%) |
242.79 |
239.54 - 244.75 |
0.8115 times |
Weekly price and charts AccenturePlc Strong weekly Stock price targets for AccenturePlc ACN are 258.81 and 288.5 | Weekly Target 1 | 236.42 | | Weekly Target 2 | 251.5 | | Weekly Target 3 | 266.10666666667 | | Weekly Target 4 | 281.19 | | Weekly Target 5 | 295.8 |
Weekly price and volumes for Accenture Plc
| Date |
Closing |
Open |
Range |
Volume |
Fri 05 December 2025 |
266.59 (6.64%) |
253.13 |
251.02 - 280.71 |
1.3911 times |
Fri 28 November 2025 |
250.00 (-0.73%) |
252.57 |
243.24 - 253.00 |
0.4683 times |
Fri 21 November 2025 |
251.85 (2.71%) |
243.93 |
237.43 - 253.97 |
1.0017 times |
Fri 14 November 2025 |
245.21 (-0.22%) |
247.34 |
238.53 - 249.15 |
1.0196 times |
Fri 07 November 2025 |
245.76 (-1.74%) |
246.03 |
239.44 - 248.99 |
0.8141 times |
Fri 31 October 2025 |
250.10 (0%) |
249.66 |
248.06 - 250.88 |
0.2397 times |
Fri 31 October 2025 |
250.10 (0.99%) |
249.44 |
245.48 - 255.44 |
1.2503 times |
Fri 24 October 2025 |
247.65 (3.88%) |
240.10 |
239.74 - 252.09 |
1.0934 times |
Fri 17 October 2025 |
238.39 (-1.06%) |
242.23 |
233.60 - 247.31 |
1.2907 times |
Fri 10 October 2025 |
240.94 (-1.76%) |
245.49 |
240.71 - 254.17 |
1.4311 times |
Fri 03 October 2025 |
245.25 (2.63%) |
240.50 |
237.25 - 252.10 |
1.7879 times |
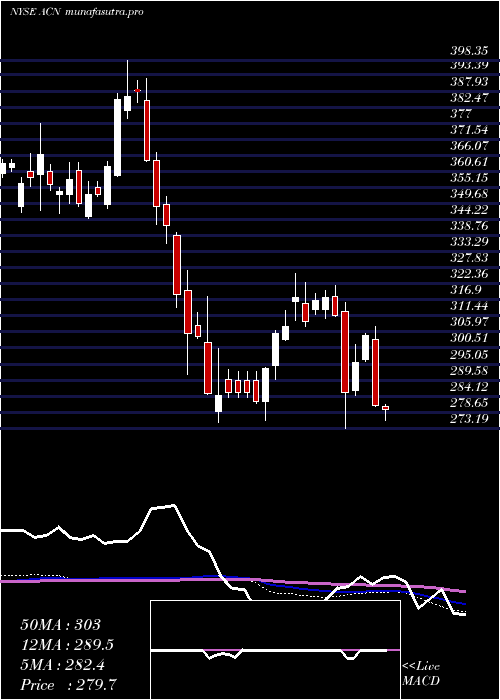
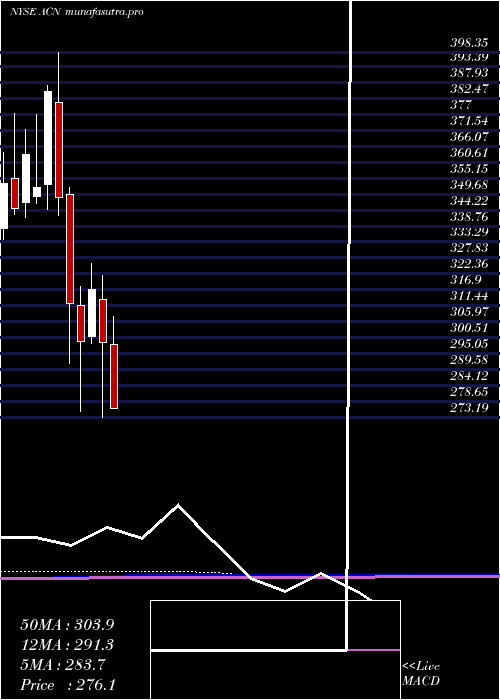
Monthly price and charts AccenturePlc Strong monthly Stock price targets for AccenturePlc ACN are 258.81 and 288.5 | Monthly Target 1 | 236.42 | | Monthly Target 2 | 251.5 | | Monthly Target 3 | 266.10666666667 | | Monthly Target 4 | 281.19 | | Monthly Target 5 | 295.8 |
Monthly price and volumes Accenture Plc
| Date |
Closing |
Open |
Range |
Volume |
Fri 05 December 2025 |
266.59 (6.64%) |
253.13 |
251.02 - 280.71 |
0.2926 times |
Fri 28 November 2025 |
250.00 (-0.04%) |
246.03 |
237.43 - 253.97 |
0.6948 times |
Fri 31 October 2025 |
250.10 (1.42%) |
245.26 |
233.60 - 255.44 |
1.2717 times |
Tue 30 September 2025 |
246.60 (-5.14%) |
257.85 |
229.40 - 260.40 |
1.6749 times |
Fri 29 August 2025 |
259.97 (-2.67%) |
264.63 |
236.67 - 265.11 |
1.2649 times |
Thu 31 July 2025 |
267.10 (-10.64%) |
298.12 |
266.13 - 307.77 |
1.028 times |
Mon 30 June 2025 |
298.89 (-5.66%) |
313.63 |
273.19 - 321.77 |
0.9116 times |
Fri 30 May 2025 |
316.82 (5.91%) |
300.80 |
298.50 - 325.71 |
0.7984 times |
Wed 30 April 2025 |
299.15 (-4.13%) |
311.60 |
275.01 - 318.00 |
0.9803 times |
Mon 31 March 2025 |
312.04 (-10.46%) |
349.42 |
291.51 - 351.99 |
1.0829 times |
Fri 28 February 2025 |
348.50 (-9.47%) |
381.14 |
342.41 - 398.35 |
0.6927 times |
DMA SMA EMA moving averages of Accenture Plc ACN
DMA (daily moving average) of Accenture Plc ACN
| DMA period | DMA value | | 5 day DMA | 265.45 | | 12 day DMA | 254.31 | | 20 day DMA | 250.26 | | 35 day DMA | 249.04 | | 50 day DMA | 247.78 | | 100 day DMA | 251.3 | | 150 day DMA | 269.92 | | 200 day DMA | 280.92 | EMA (exponential moving average) of Accenture Plc ACN
| EMA period | EMA current | EMA prev | EMA prev2 | | 5 day EMA | 264.51 | 263.47 | 260.53 | | 12 day EMA | 257.62 | 255.99 | 253.56 | | 20 day EMA | 253.81 | 252.46 | 250.68 | | 35 day EMA | 250.36 | 249.4 | 248.23 | | 50 day EMA | 248.72 | 247.99 | 247.12 |
SMA (simple moving average) of Accenture Plc ACN
| SMA period | SMA current | SMA prev | SMA prev2 | | 5 day SMA | 265.45 | 262.13 | 257.83 | | 12 day SMA | 254.31 | 252.1 | 249.76 | | 20 day SMA | 250.26 | 249 | 247.92 | | 35 day SMA | 249.04 | 248.11 | 247.26 | | 50 day SMA | 247.78 | 247.1 | 246.5 | | 100 day SMA | 251.3 | 251.43 | 251.49 | | 150 day SMA | 269.92 | 270.15 | 270.35 | | 200 day SMA | 280.92 | 281.53 | 282.12 |
|
|
