AbbottLaboratories ABT full analysis,charts,indicators,moving averages,SMA,DMA,EMA,ADX,MACD,RSIAbbott Laboratories ABT WideScreen charts, DMA,SMA,EMA technical analysis, forecast prediction, by indicators ADX,MACD,RSI,CCI NYSE stock exchange
operates under Health Care sector & deals in Major Pharmaceuticals
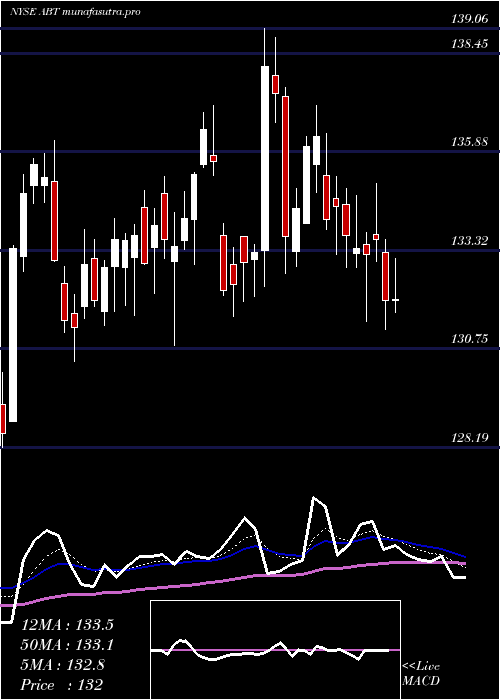
Daily price and charts and targets AbbottLaboratories Strong Daily Stock price targets for AbbottLaboratories ABT are 128.82 and 130.51 | Daily Target 1 | 127.46 | | Daily Target 2 | 128.49 | | Daily Target 3 | 129.15333333333 | | Daily Target 4 | 130.18 | | Daily Target 5 | 130.84 |
Daily price and volume Abbott Laboratories
| Date |
Closing |
Open |
Range |
Volume |
Mon 20 October 2025 |
129.51 (0.79%) |
128.44 |
128.13 - 129.82 |
0.8548 times |
Fri 17 October 2025 |
128.50 (0.68%) |
127.00 |
126.80 - 129.26 |
0.7312 times |
Thu 16 October 2025 |
127.63 (-1.41%) |
129.53 |
126.87 - 131.16 |
1.437 times |
Wed 15 October 2025 |
129.45 (-2.87%) |
128.01 |
125.74 - 131.48 |
2.1929 times |
Tue 14 October 2025 |
133.27 (1.44%) |
131.46 |
131.23 - 133.34 |
1.1987 times |
Mon 13 October 2025 |
131.38 (-0.9%) |
132.00 |
130.87 - 132.76 |
0.5897 times |
Fri 10 October 2025 |
132.57 (-0.56%) |
134.19 |
132.05 - 134.50 |
0.8318 times |
Thu 09 October 2025 |
133.31 (-0.71%) |
134.58 |
133.00 - 135.13 |
0.4763 times |
Wed 08 October 2025 |
134.27 (0.94%) |
132.81 |
132.17 - 134.72 |
0.979 times |
Tue 07 October 2025 |
133.02 (-0.55%) |
134.09 |
131.93 - 134.09 |
0.7086 times |
Mon 06 October 2025 |
133.76 (-0.62%) |
134.59 |
133.45 - 135.24 |
0.7034 times |
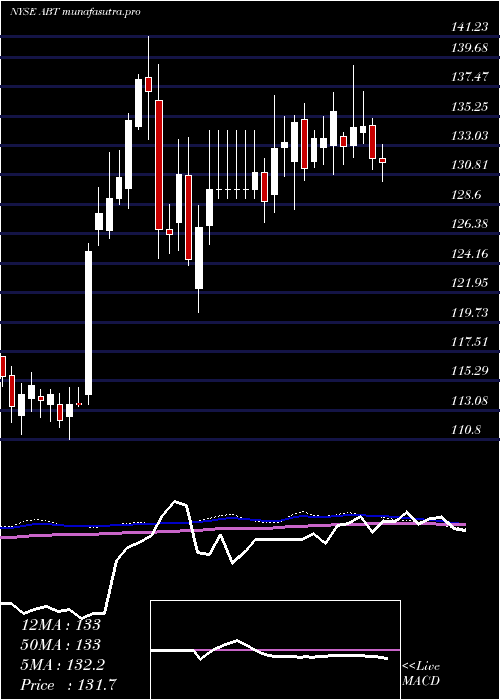
Weekly price and charts AbbottLaboratories Strong weekly Stock price targets for AbbottLaboratories ABT are 128.82 and 130.51 | Weekly Target 1 | 127.46 | | Weekly Target 2 | 128.49 | | Weekly Target 3 | 129.15333333333 | | Weekly Target 4 | 130.18 | | Weekly Target 5 | 130.84 |
Weekly price and volumes for Abbott Laboratories
| Date |
Closing |
Open |
Range |
Volume |
Mon 20 October 2025 |
129.51 (0.79%) |
128.44 |
128.13 - 129.82 |
0.2461 times |
Fri 17 October 2025 |
128.50 (-3.07%) |
132.00 |
125.74 - 133.34 |
1.7706 times |
Fri 10 October 2025 |
132.57 (-1.5%) |
134.59 |
131.93 - 135.24 |
1.065 times |
Fri 03 October 2025 |
134.59 (0.78%) |
133.00 |
129.08 - 135.45 |
1.3495 times |
Fri 26 September 2025 |
133.55 (-1.83%) |
135.33 |
131.18 - 137.49 |
0.9763 times |
Fri 19 September 2025 |
136.04 (1.73%) |
133.88 |
130.96 - 136.73 |
1.3559 times |
Fri 12 September 2025 |
133.73 (0.59%) |
132.26 |
127.44 - 134.96 |
1.2024 times |
Fri 05 September 2025 |
132.94 (0.21%) |
132.68 |
130.21 - 134.33 |
0.8025 times |
Fri 29 August 2025 |
132.66 (0%) |
132.02 |
131.17 - 132.85 |
0.1877 times |
Fri 29 August 2025 |
132.66 (0.05%) |
132.72 |
130.14 - 132.96 |
1.044 times |
Fri 22 August 2025 |
132.59 (0.64%) |
131.63 |
128.68 - 133.81 |
0.8652 times |
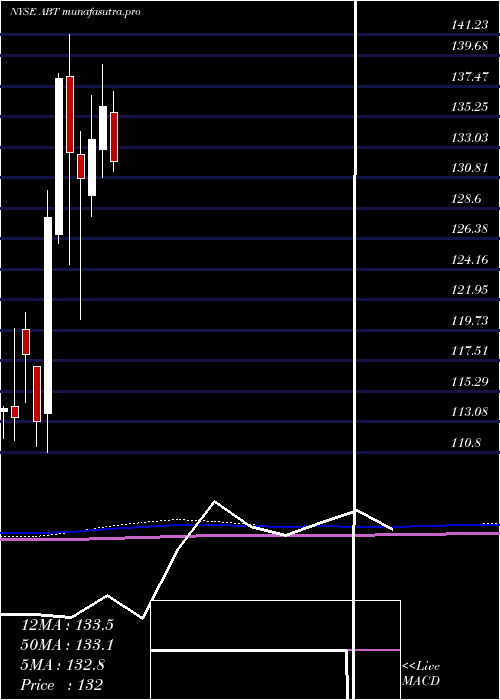
Monthly price and charts AbbottLaboratories Strong monthly Stock price targets for AbbottLaboratories ABT are 122.77 and 132.48 | Monthly Target 1 | 120.52 | | Monthly Target 2 | 125.02 | | Monthly Target 3 | 130.23333333333 | | Monthly Target 4 | 134.73 | | Monthly Target 5 | 139.94 |
Monthly price and volumes Abbott Laboratories
| Date |
Closing |
Open |
Range |
Volume |
Mon 20 October 2025 |
129.51 (-3.31%) |
134.80 |
125.74 - 135.45 |
0.7126 times |
Tue 30 September 2025 |
133.94 (0.96%) |
132.68 |
127.44 - 137.49 |
0.8782 times |
Fri 29 August 2025 |
132.66 (5.13%) |
125.47 |
125.47 - 134.71 |
0.8541 times |
Thu 31 July 2025 |
126.19 (-7.22%) |
135.54 |
119.77 - 137.08 |
1.2825 times |
Mon 30 June 2025 |
136.01 (1.82%) |
132.86 |
130.83 - 139.06 |
0.8724 times |
Fri 30 May 2025 |
133.58 (2.16%) |
129.50 |
128.00 - 136.80 |
1.0623 times |
Wed 30 April 2025 |
130.75 (-1.43%) |
132.48 |
120.47 - 134.16 |
1.1826 times |
Mon 31 March 2025 |
132.65 (-3.88%) |
138.17 |
124.50 - 141.23 |
1.1111 times |
Fri 28 February 2025 |
138.01 (7.88%) |
126.65 |
126.00 - 138.37 |
0.8469 times |
Fri 31 January 2025 |
127.93 (13.1%) |
113.69 |
110.86 - 129.85 |
1.1974 times |
Tue 31 December 2024 |
113.11 (-4.11%) |
117.10 |
111.28 - 117.10 |
0.5741 times |
DMA SMA EMA moving averages of Abbott Laboratories ABT
DMA (daily moving average) of Abbott Laboratories ABT
| DMA period | DMA value | | 5 day DMA | 129.67 | | 12 day DMA | 131.77 | | 20 day DMA | 132.57 | | 35 day DMA | 132.75 | | 50 day DMA | 132.36 | | 100 day DMA | 132.03 | | 150 day DMA | 131.4 | | 200 day DMA | 130.39 | EMA (exponential moving average) of Abbott Laboratories ABT
| EMA period | EMA current | EMA prev | EMA prev2 | | 5 day EMA | 129.66 | 129.74 | 130.36 | | 12 day EMA | 131.05 | 131.33 | 131.84 | | 20 day EMA | 131.78 | 132.02 | 132.39 | | 35 day EMA | 132.06 | 132.21 | 132.43 | | 50 day EMA | 132.05 | 132.15 | 132.3 |
SMA (simple moving average) of Abbott Laboratories ABT
| SMA period | SMA current | SMA prev | SMA prev2 | | 5 day SMA | 129.67 | 130.05 | 130.86 | | 12 day SMA | 131.77 | 132.06 | 132.48 | | 20 day SMA | 132.57 | 132.93 | 133.3 | | 35 day SMA | 132.75 | 132.84 | 132.96 | | 50 day SMA | 132.36 | 132.39 | 132.51 | | 100 day SMA | 132.03 | 132.07 | 132.1 | | 150 day SMA | 131.4 | 131.38 | 131.37 | | 200 day SMA | 130.39 | 130.31 | 130.24 |
|
|
