AbmIndustries ABM full analysis,charts,indicators,moving averages,SMA,DMA,EMA,ADX,MACD,RSIAbm Industries ABM WideScreen charts, DMA,SMA,EMA technical analysis, forecast prediction, by indicators ADX,MACD,RSI,CCI NYSE stock exchange
operates under Finance sector & deals in Diversified Commercial Services
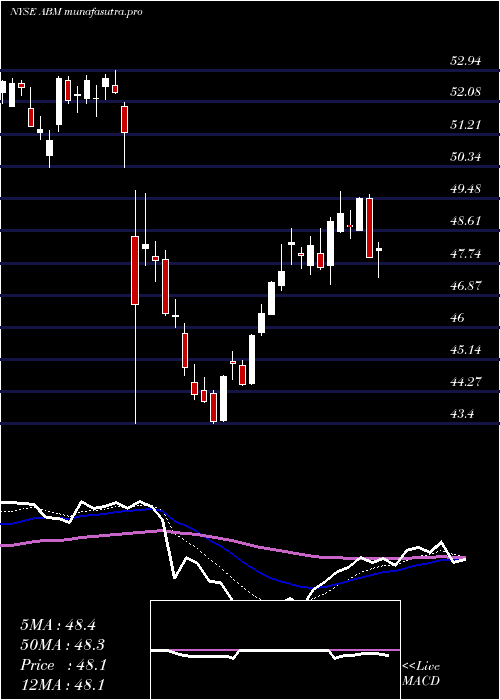
Daily price and charts and targets AbmIndustries Strong Daily Stock price targets for AbmIndustries ABM are 45.31 and 45.82 | Daily Target 1 | 44.89 | | Daily Target 2 | 45.21 | | Daily Target 3 | 45.396666666667 | | Daily Target 4 | 45.72 | | Daily Target 5 | 45.91 |
Daily price and volume Abm Industries
| Date |
Closing |
Open |
Range |
Volume |
Mon 20 October 2025 |
45.54 (1.07%) |
45.07 |
45.07 - 45.58 |
0.919 times |
Fri 17 October 2025 |
45.06 (0.83%) |
44.69 |
44.56 - 45.06 |
0.9992 times |
Thu 16 October 2025 |
44.69 (-1.35%) |
45.17 |
44.64 - 45.33 |
1.0781 times |
Wed 15 October 2025 |
45.30 (-0.29%) |
45.61 |
45.12 - 45.80 |
0.9965 times |
Tue 14 October 2025 |
45.43 (1%) |
44.74 |
44.73 - 45.70 |
0.988 times |
Mon 13 October 2025 |
44.98 (1.19%) |
44.70 |
44.34 - 45.13 |
0.9658 times |
Fri 10 October 2025 |
44.45 (-1.18%) |
45.12 |
44.38 - 45.34 |
0.9023 times |
Thu 09 October 2025 |
44.98 (-1.64%) |
45.77 |
44.87 - 45.85 |
0.8736 times |
Wed 08 October 2025 |
45.73 (0.26%) |
45.48 |
45.42 - 45.97 |
0.8752 times |
Tue 07 October 2025 |
45.61 (-1.36%) |
46.35 |
45.50 - 46.60 |
1.4023 times |
Mon 06 October 2025 |
46.24 (-0.71%) |
46.33 |
46.07 - 46.72 |
0.6078 times |
Weekly price and charts AbmIndustries Strong weekly Stock price targets for AbmIndustries ABM are 45.31 and 45.82 | Weekly Target 1 | 44.89 | | Weekly Target 2 | 45.21 | | Weekly Target 3 | 45.396666666667 | | Weekly Target 4 | 45.72 | | Weekly Target 5 | 45.91 |
Weekly price and volumes for Abm Industries
| Date |
Closing |
Open |
Range |
Volume |
Mon 20 October 2025 |
45.54 (1.07%) |
45.07 |
45.07 - 45.58 |
0.1684 times |
Fri 17 October 2025 |
45.06 (1.37%) |
44.70 |
44.34 - 45.80 |
0.9213 times |
Fri 10 October 2025 |
44.45 (-4.55%) |
46.33 |
44.38 - 46.72 |
0.8542 times |
Fri 03 October 2025 |
46.57 (1.73%) |
46.02 |
45.14 - 47.16 |
0.8773 times |
Fri 26 September 2025 |
45.78 (1.67%) |
45.07 |
44.56 - 46.17 |
1.0443 times |
Fri 19 September 2025 |
45.03 (-1.66%) |
45.86 |
44.60 - 45.98 |
1.4918 times |
Fri 12 September 2025 |
45.79 (-5.12%) |
47.28 |
45.40 - 47.71 |
1.688 times |
Fri 05 September 2025 |
48.26 (-1.85%) |
48.78 |
44.06 - 49.14 |
1.8907 times |
Fri 29 August 2025 |
49.17 (0%) |
49.15 |
48.71 - 49.43 |
0.1711 times |
Fri 29 August 2025 |
49.17 (-0.99%) |
49.44 |
48.59 - 49.69 |
0.893 times |
Fri 22 August 2025 |
49.66 (3.16%) |
48.19 |
47.49 - 49.94 |
0.8586 times |
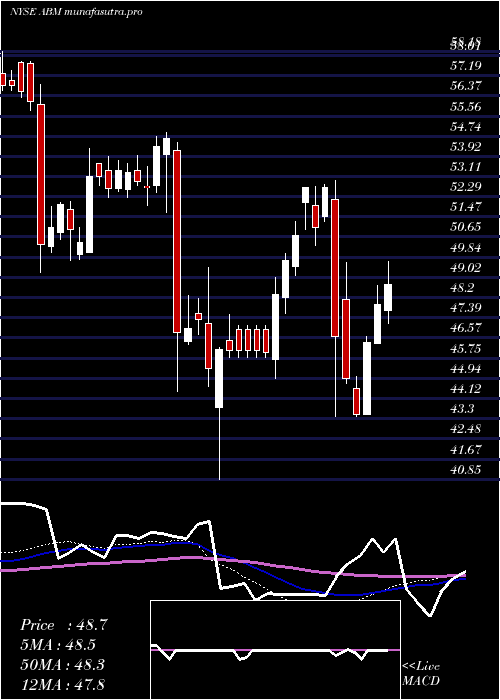
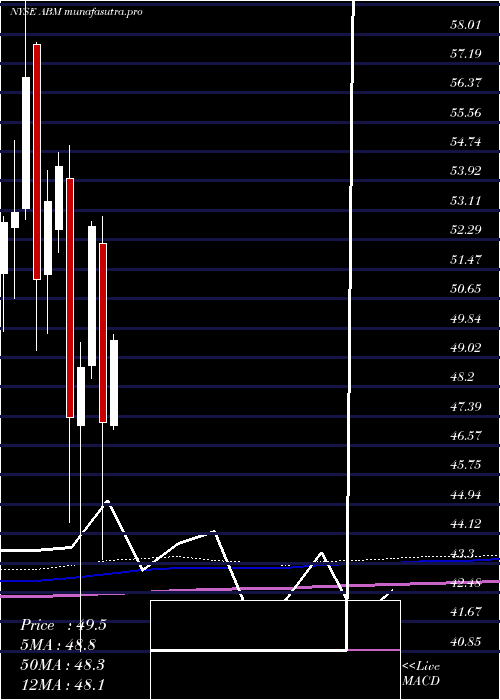
Monthly price and charts AbmIndustries Strong monthly Stock price targets for AbmIndustries ABM are 43.53 and 46.35 | Monthly Target 1 | 42.86 | | Monthly Target 2 | 44.2 | | Monthly Target 3 | 45.68 | | Monthly Target 4 | 47.02 | | Monthly Target 5 | 48.5 |
Monthly price and volumes Abm Industries
| Date |
Closing |
Open |
Range |
Volume |
Mon 20 October 2025 |
45.54 (-1.26%) |
45.83 |
44.34 - 47.16 |
0.5996 times |
Tue 30 September 2025 |
46.12 (-6.2%) |
48.78 |
44.06 - 49.14 |
1.5197 times |
Fri 29 August 2025 |
49.17 (6.59%) |
45.62 |
45.29 - 49.94 |
0.8816 times |
Thu 31 July 2025 |
46.13 (-2.29%) |
47.13 |
45.92 - 49.66 |
1.0847 times |
Mon 30 June 2025 |
47.21 (-10.33%) |
52.18 |
43.40 - 52.94 |
1.4109 times |
Fri 30 May 2025 |
52.65 (8.02%) |
48.80 |
48.42 - 52.80 |
0.6554 times |
Wed 30 April 2025 |
48.74 (2.91%) |
47.13 |
40.85 - 49.42 |
1.4594 times |
Mon 31 March 2025 |
47.36 (-12.83%) |
54.00 |
44.42 - 54.90 |
1.1749 times |
Fri 28 February 2025 |
54.33 (1.82%) |
52.56 |
51.92 - 54.72 |
0.5266 times |
Fri 31 January 2025 |
53.36 (4.26%) |
51.33 |
49.69 - 54.22 |
0.6873 times |
Tue 31 December 2024 |
51.18 (-9.89%) |
57.73 |
49.21 - 57.76 |
0.6862 times |
DMA SMA EMA moving averages of Abm Industries ABM
DMA (daily moving average) of Abm Industries ABM
| DMA period | DMA value | | 5 day DMA | 45.2 | | 12 day DMA | 45.38 | | 20 day DMA | 45.55 | | 35 day DMA | 45.94 | | 50 day DMA | 46.79 | | 100 day DMA | 47.26 | | 150 day DMA | 47.61 | | 200 day DMA | 48.77 | EMA (exponential moving average) of Abm Industries ABM
| EMA period | EMA current | EMA prev | EMA prev2 | | 5 day EMA | 45.23 | 45.07 | 45.07 | | 12 day EMA | 45.35 | 45.31 | 45.36 | | 20 day EMA | 45.57 | 45.57 | 45.62 | | 35 day EMA | 46.13 | 46.17 | 46.24 | | 50 day EMA | 46.68 | 46.73 | 46.8 |
SMA (simple moving average) of Abm Industries ABM
| SMA period | SMA current | SMA prev | SMA prev2 | | 5 day SMA | 45.2 | 45.09 | 44.97 | | 12 day SMA | 45.38 | 45.46 | 45.6 | | 20 day SMA | 45.55 | 45.56 | 45.56 | | 35 day SMA | 45.94 | 46.05 | 46.16 | | 50 day SMA | 46.79 | 46.83 | 46.88 | | 100 day SMA | 47.26 | 47.33 | 47.39 | | 150 day SMA | 47.61 | 47.63 | 47.64 | | 200 day SMA | 48.77 | 48.8 | 48.84 |
|
|
