AmericanAssets AAT full analysis,charts,indicators,moving averages,SMA,DMA,EMA,ADX,MACD,RSIAmerican Assets AAT WideScreen charts, DMA,SMA,EMA technical analysis, forecast prediction, by indicators ADX,MACD,RSI,CCI NYSE stock exchange
operates under Consumer Services sector & deals in Real Estate Investment Trusts
Daily price and charts and targets AmericanAssets Strong Daily Stock price targets for AmericanAssets AAT are 18.54 and 18.86 | Daily Target 1 | 18.47 | | Daily Target 2 | 18.6 | | Daily Target 3 | 18.79 | | Daily Target 4 | 18.92 | | Daily Target 5 | 19.11 |
Daily price and volume American Assets
| Date |
Closing |
Open |
Range |
Volume |
Fri 05 December 2025 |
18.73 (-0.79%) |
18.80 |
18.66 - 18.98 |
0.8661 times |
Thu 04 December 2025 |
18.88 (-3.18%) |
19.13 |
18.82 - 19.15 |
1.0975 times |
Wed 03 December 2025 |
19.50 (0.31%) |
19.48 |
19.35 - 19.62 |
1.1013 times |
Tue 02 December 2025 |
19.44 (0%) |
19.59 |
19.39 - 19.59 |
0.9559 times |
Mon 01 December 2025 |
19.44 (-0.31%) |
19.36 |
19.36 - 19.56 |
0.8667 times |
Fri 28 November 2025 |
19.50 (0.21%) |
19.39 |
19.34 - 19.52 |
0.5587 times |
Wed 26 November 2025 |
19.46 (0.15%) |
19.35 |
19.35 - 19.68 |
1.8447 times |
Tue 25 November 2025 |
19.43 (0.99%) |
19.30 |
19.30 - 19.66 |
0.9862 times |
Mon 24 November 2025 |
19.24 (0.37%) |
19.10 |
19.01 - 19.27 |
0.7461 times |
Fri 21 November 2025 |
19.17 (3.29%) |
18.69 |
18.56 - 19.19 |
0.9769 times |
Thu 20 November 2025 |
18.56 (-0.8%) |
18.78 |
18.52 - 18.95 |
1.1878 times |
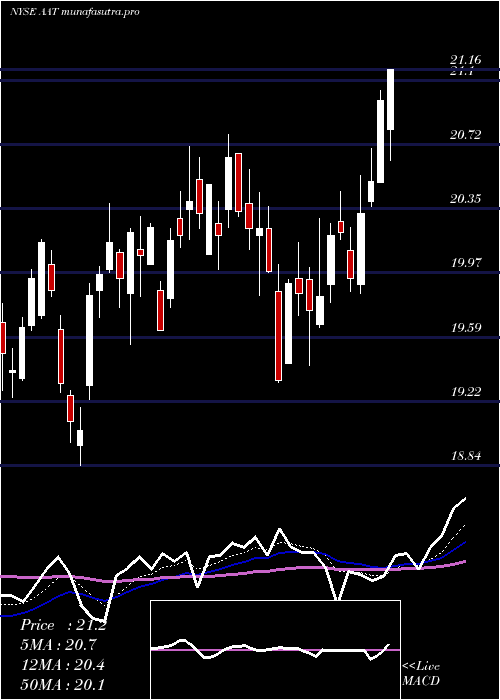
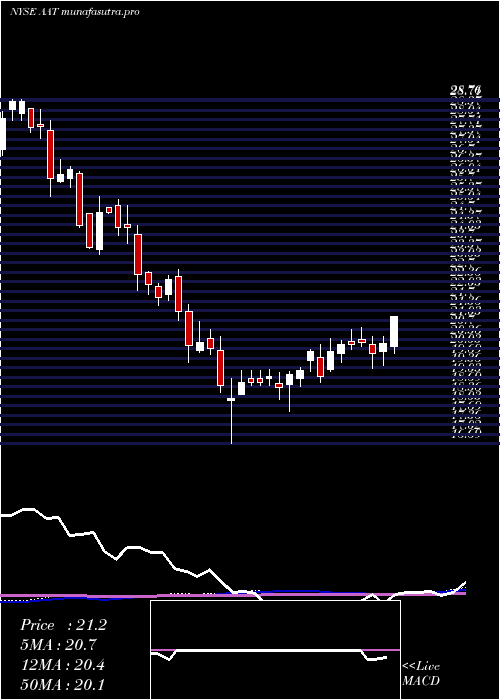
Weekly price and charts AmericanAssets Strong weekly Stock price targets for AmericanAssets AAT are 18.22 and 19.18 | Weekly Target 1 | 18.04 | | Weekly Target 2 | 18.39 | | Weekly Target 3 | 19.003333333333 | | Weekly Target 4 | 19.35 | | Weekly Target 5 | 19.96 |
Weekly price and volumes for American Assets
| Date |
Closing |
Open |
Range |
Volume |
Fri 05 December 2025 |
18.73 (-3.95%) |
19.36 |
18.66 - 19.62 |
1.0801 times |
Fri 28 November 2025 |
19.50 (1.72%) |
19.10 |
19.01 - 19.68 |
0.914 times |
Fri 21 November 2025 |
19.17 (-0.83%) |
19.30 |
18.52 - 19.33 |
1.0936 times |
Fri 14 November 2025 |
19.33 (0.05%) |
19.33 |
18.92 - 19.64 |
1.023 times |
Fri 07 November 2025 |
19.32 (1.1%) |
18.90 |
18.62 - 19.41 |
1.2151 times |
Fri 31 October 2025 |
19.11 (0%) |
18.96 |
18.83 - 19.25 |
0.3295 times |
Fri 31 October 2025 |
19.11 (-4.21%) |
19.88 |
18.81 - 20.22 |
1.5803 times |
Fri 24 October 2025 |
19.95 (2.57%) |
19.51 |
19.28 - 20.28 |
0.8525 times |
Fri 17 October 2025 |
19.45 (2.05%) |
19.24 |
18.94 - 19.77 |
0.8931 times |
Fri 10 October 2025 |
19.06 (-6.57%) |
20.40 |
19.04 - 20.57 |
1.0188 times |
Fri 03 October 2025 |
20.40 (0.54%) |
20.31 |
20.03 - 20.70 |
0.9297 times |
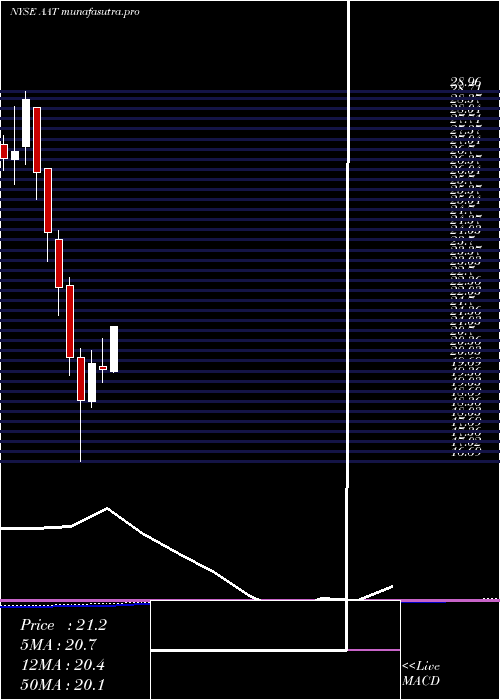
Monthly price and charts AmericanAssets Strong monthly Stock price targets for AmericanAssets AAT are 18.22 and 19.18 | Monthly Target 1 | 18.04 | | Monthly Target 2 | 18.39 | | Monthly Target 3 | 19.003333333333 | | Monthly Target 4 | 19.35 | | Monthly Target 5 | 19.96 |
Monthly price and volumes American Assets
| Date |
Closing |
Open |
Range |
Volume |
Fri 05 December 2025 |
18.73 (-3.95%) |
19.36 |
18.66 - 19.62 |
0.2283 times |
Fri 28 November 2025 |
19.50 (2.04%) |
18.90 |
18.52 - 19.68 |
0.8972 times |
Fri 31 October 2025 |
19.11 (-5.95%) |
20.25 |
18.81 - 20.70 |
1.1288 times |
Tue 30 September 2025 |
20.32 (-2.78%) |
20.78 |
19.98 - 21.13 |
0.8696 times |
Fri 29 August 2025 |
20.90 (9.83%) |
19.00 |
18.49 - 21.03 |
0.9149 times |
Thu 31 July 2025 |
19.03 (-3.65%) |
19.67 |
18.64 - 21.40 |
1.3472 times |
Mon 30 June 2025 |
19.75 (-0.95%) |
19.85 |
19.33 - 20.78 |
1.1728 times |
Fri 30 May 2025 |
19.94 (6.46%) |
18.70 |
18.50 - 20.38 |
0.9762 times |
Wed 30 April 2025 |
18.73 (-7%) |
20.15 |
16.69 - 20.45 |
1.3425 times |
Mon 31 March 2025 |
20.14 (-10.33%) |
22.54 |
19.56 - 22.79 |
1.1226 times |
Fri 28 February 2025 |
22.46 (-7.5%) |
24.04 |
21.53 - 24.33 |
0.8051 times |
DMA SMA EMA moving averages of American Assets AAT
DMA (daily moving average) of American Assets AAT
| DMA period | DMA value | | 5 day DMA | 19.2 | | 12 day DMA | 19.17 | | 20 day DMA | 19.18 | | 35 day DMA | 19.31 | | 50 day DMA | 19.48 | | 100 day DMA | 19.8 | | 150 day DMA | 19.85 | | 200 day DMA | 19.88 | EMA (exponential moving average) of American Assets AAT
| EMA period | EMA current | EMA prev | EMA prev2 | | 5 day EMA | 19.08 | 19.25 | 19.43 | | 12 day EMA | 19.17 | 19.25 | 19.32 | | 20 day EMA | 19.22 | 19.27 | 19.31 | | 35 day EMA | 19.38 | 19.42 | 19.45 | | 50 day EMA | 19.54 | 19.57 | 19.6 |
SMA (simple moving average) of American Assets AAT
| SMA period | SMA current | SMA prev | SMA prev2 | | 5 day SMA | 19.2 | 19.35 | 19.47 | | 12 day SMA | 19.17 | 19.18 | 19.18 | | 20 day SMA | 19.18 | 19.19 | 19.19 | | 35 day SMA | 19.31 | 19.33 | 19.35 | | 50 day SMA | 19.48 | 19.51 | 19.54 | | 100 day SMA | 19.8 | 19.82 | 19.84 | | 150 day SMA | 19.85 | 19.86 | 19.85 | | 200 day SMA | 19.88 | 19.9 | 19.91 |
|
|
