AlcoaCorporation AA full analysis,charts,indicators,moving averages,SMA,DMA,EMA,ADX,MACD,RSIAlcoa Corporation AA WideScreen charts, DMA,SMA,EMA technical analysis, forecast prediction, by indicators ADX,MACD,RSI,CCI NYSE stock exchange
operates under Basic Industries sector & deals in Aluminum
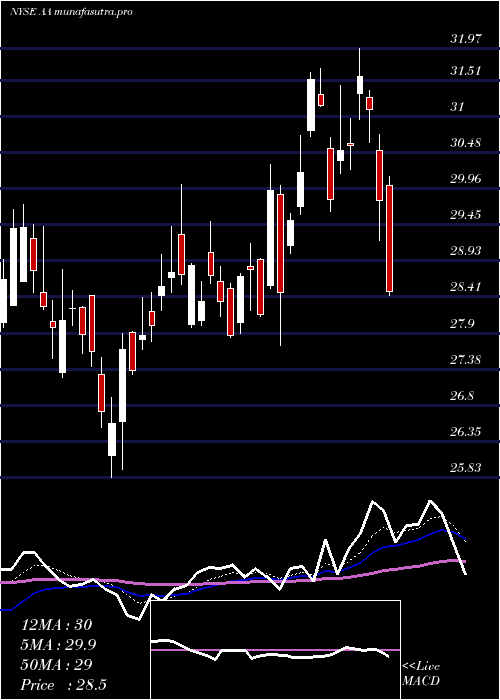
Daily price and charts and targets AlcoaCorporation Strong Daily Stock price targets for AlcoaCorporation AA are 43.2 and 44.31 | Daily Target 1 | 43 | | Daily Target 2 | 43.39 | | Daily Target 3 | 44.113333333333 | | Daily Target 4 | 44.5 | | Daily Target 5 | 45.22 |
Daily price and volume Alcoa Corporation
| Date |
Closing |
Open |
Range |
Volume |
Fri 05 December 2025 |
43.77 (-0.55%) |
44.25 |
43.73 - 44.84 |
1.0117 times |
Thu 04 December 2025 |
44.01 (-0.2%) |
43.76 |
43.23 - 44.46 |
0.774 times |
Wed 03 December 2025 |
44.10 (6.39%) |
42.41 |
42.32 - 44.96 |
1.7607 times |
Tue 02 December 2025 |
41.45 (-0.48%) |
41.87 |
41.30 - 42.23 |
0.6586 times |
Mon 01 December 2025 |
41.65 (-0.22%) |
41.82 |
41.45 - 42.73 |
1.4685 times |
Fri 28 November 2025 |
41.74 (0.41%) |
42.17 |
41.48 - 42.17 |
0.7425 times |
Wed 26 November 2025 |
41.57 (6.05%) |
39.74 |
39.34 - 42.16 |
0.9432 times |
Tue 25 November 2025 |
39.20 (1.21%) |
38.87 |
38.49 - 39.76 |
0.9868 times |
Mon 24 November 2025 |
38.73 (6.58%) |
36.49 |
36.35 - 38.84 |
0.633 times |
Fri 21 November 2025 |
36.34 (1.42%) |
35.51 |
35.12 - 36.97 |
1.021 times |
Thu 20 November 2025 |
35.83 (-2.42%) |
37.41 |
35.55 - 38.28 |
1.1204 times |
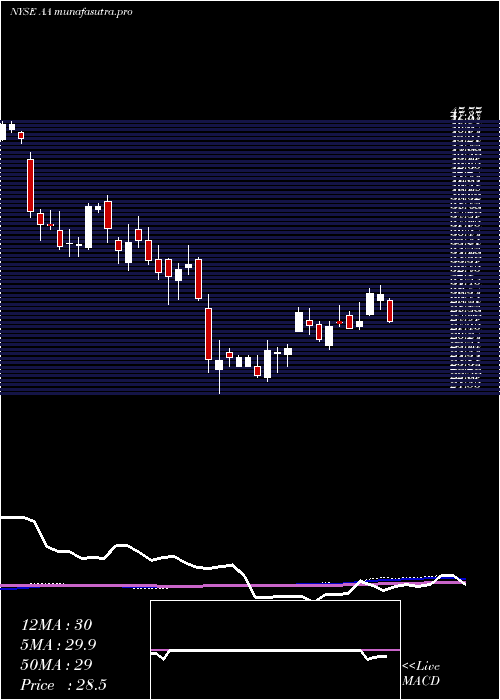
Weekly price and charts AlcoaCorporation Strong weekly Stock price targets for AlcoaCorporation AA are 42.54 and 46.2 | Weekly Target 1 | 39.68 | | Weekly Target 2 | 41.73 | | Weekly Target 3 | 43.343333333333 | | Weekly Target 4 | 45.39 | | Weekly Target 5 | 47 |
Weekly price and volumes for Alcoa Corporation
| Date |
Closing |
Open |
Range |
Volume |
Fri 05 December 2025 |
43.77 (4.86%) |
41.82 |
41.30 - 44.96 |
1.0744 times |
Fri 28 November 2025 |
41.74 (14.86%) |
36.49 |
36.35 - 42.17 |
0.626 times |
Fri 21 November 2025 |
36.34 (-3.33%) |
37.02 |
35.12 - 38.28 |
1.0245 times |
Fri 14 November 2025 |
37.59 (0.67%) |
38.54 |
36.42 - 40.38 |
0.9067 times |
Fri 07 November 2025 |
37.34 (1.49%) |
36.26 |
35.22 - 37.58 |
0.697 times |
Fri 31 October 2025 |
36.79 (0%) |
37.02 |
36.42 - 37.02 |
0.1708 times |
Fri 31 October 2025 |
36.79 (-6.7%) |
39.74 |
36.30 - 40.81 |
1.2807 times |
Fri 24 October 2025 |
39.43 (9.07%) |
36.06 |
35.45 - 41.55 |
1.6858 times |
Fri 17 October 2025 |
36.15 (3.23%) |
36.41 |
35.13 - 37.90 |
0.9561 times |
Fri 10 October 2025 |
35.02 (0.98%) |
34.53 |
33.60 - 38.09 |
1.5779 times |
Fri 03 October 2025 |
34.68 (6.02%) |
33.58 |
31.98 - 35.25 |
1.2163 times |
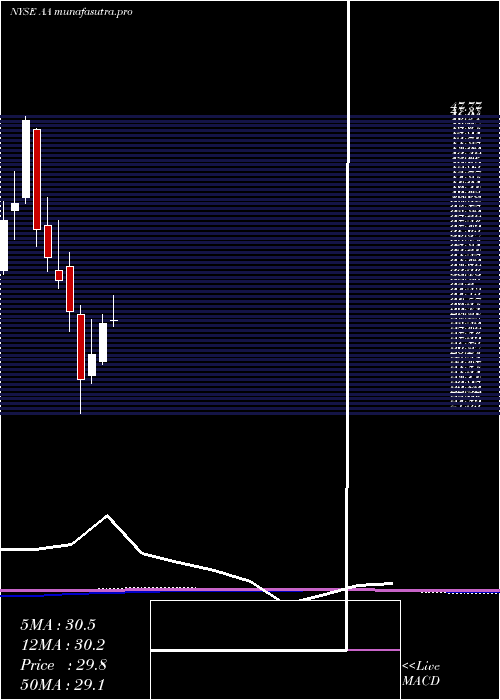
Monthly price and charts AlcoaCorporation Strong monthly Stock price targets for AlcoaCorporation AA are 42.54 and 46.2 | Monthly Target 1 | 39.68 | | Monthly Target 2 | 41.73 | | Monthly Target 3 | 43.343333333333 | | Monthly Target 4 | 45.39 | | Monthly Target 5 | 47 |
Monthly price and volumes Alcoa Corporation
| Date |
Closing |
Open |
Range |
Volume |
Fri 05 December 2025 |
43.77 (4.86%) |
41.82 |
41.30 - 44.96 |
0.246 times |
Fri 28 November 2025 |
41.74 (13.45%) |
36.26 |
35.12 - 42.17 |
0.7451 times |
Fri 31 October 2025 |
36.79 (11.86%) |
33.00 |
32.85 - 41.55 |
1.44 times |
Tue 30 September 2025 |
32.89 (2.17%) |
31.10 |
30.21 - 34.25 |
1.1694 times |
Fri 29 August 2025 |
32.19 (7.41%) |
29.20 |
28.11 - 32.47 |
0.8939 times |
Thu 31 July 2025 |
29.97 (1.56%) |
29.71 |
28.12 - 32.33 |
1.2037 times |
Mon 30 June 2025 |
29.51 (10.24%) |
26.15 |
25.83 - 30.30 |
1.0118 times |
Fri 30 May 2025 |
26.77 (9.13%) |
24.85 |
24.15 - 29.86 |
1.1187 times |
Wed 30 April 2025 |
24.53 (-19.57%) |
30.30 |
21.53 - 31.09 |
1.3612 times |
Mon 31 March 2025 |
30.50 (-8.27%) |
34.50 |
28.80 - 35.77 |
0.8102 times |
Fri 28 February 2025 |
33.25 (-5.86%) |
34.18 |
32.55 - 38.58 |
0.7504 times |
DMA SMA EMA moving averages of Alcoa Corporation AA
DMA (daily moving average) of Alcoa Corporation AA
| DMA period | DMA value | | 5 day DMA | 43 | | 12 day DMA | 40.43 | | 20 day DMA | 39.34 | | 35 day DMA | 38.59 | | 50 day DMA | 37.53 | | 100 day DMA | 34.37 | | 150 day DMA | 32.39 | | 200 day DMA | 31.65 | EMA (exponential moving average) of Alcoa Corporation AA
| EMA period | EMA current | EMA prev | EMA prev2 | | 5 day EMA | 43 | 42.62 | 41.93 | | 12 day EMA | 41.25 | 40.79 | 40.21 | | 20 day EMA | 40.07 | 39.68 | 39.22 | | 35 day EMA | 38.68 | 38.38 | 38.05 | | 50 day EMA | 37.63 | 37.38 | 37.11 |
SMA (simple moving average) of Alcoa Corporation AA
| SMA period | SMA current | SMA prev | SMA prev2 | | 5 day SMA | 43 | 42.59 | 42.1 | | 12 day SMA | 40.43 | 39.82 | 39.14 | | 20 day SMA | 39.34 | 38.99 | 38.58 | | 35 day SMA | 38.59 | 38.38 | 38.17 | | 50 day SMA | 37.53 | 37.29 | 37.03 | | 100 day SMA | 34.37 | 34.22 | 34.06 | | 150 day SMA | 32.39 | 32.26 | 32.13 | | 200 day SMA | 31.65 | 31.62 | 31.58 |
|
|
