ZeeEntertainment ZEEL full analysis,charts,indicators,moving averages,SMA,DMA,EMA,ADX,MACD,RSIZee Entertainment ZEEL WideScreen charts, DMA,SMA,EMA technical analysis, forecast prediction, by indicators ADX,MACD,RSI,CCI NSE stock exchange
operates under Broadcasting & Cable TV sector
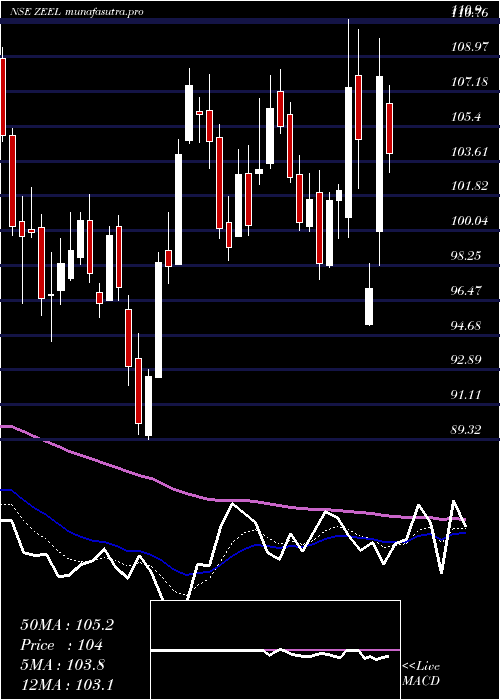
Daily price and charts and targets ZeeEntertainment Strong Daily Stock price targets for ZeeEntertainment ZEEL are 93.05 and 95.54 | Daily Target 1 | 91.28 | | Daily Target 2 | 92.32 | | Daily Target 3 | 93.77 | | Daily Target 4 | 94.81 | | Daily Target 5 | 96.26 |
Daily price and volume Zee Entertainment
| Date |
Closing |
Open |
Range |
Volume |
Wed 10 December 2025 |
93.36 (0.68%) |
92.98 |
92.73 - 95.22 |
0.6907 times |
Tue 09 December 2025 |
92.73 (-1%) |
93.84 |
91.64 - 94.08 |
0.9608 times |
Mon 08 December 2025 |
93.67 (-3.93%) |
97.58 |
93.33 - 98.39 |
0.9305 times |
Fri 05 December 2025 |
97.50 (-0.35%) |
97.84 |
96.96 - 98.30 |
0.518 times |
Thu 04 December 2025 |
97.84 (-1.9%) |
99.50 |
97.50 - 99.97 |
0.4833 times |
Wed 03 December 2025 |
99.74 (1.93%) |
97.37 |
96.90 - 99.99 |
0.9459 times |
Tue 02 December 2025 |
97.85 (-2.27%) |
99.56 |
96.90 - 100.30 |
0.7593 times |
Mon 01 December 2025 |
100.12 (-1.33%) |
101.80 |
99.70 - 101.88 |
0.8663 times |
Fri 28 November 2025 |
101.47 (3.45%) |
98.20 |
97.35 - 104.60 |
3.3565 times |
Thu 27 November 2025 |
98.09 (0.27%) |
97.95 |
97.65 - 99.20 |
0.4887 times |
Wed 26 November 2025 |
97.83 (0.85%) |
97.35 |
97.30 - 98.10 |
0.549 times |
Weekly price and charts ZeeEntertainment Strong weekly Stock price targets for ZeeEntertainment ZEEL are 89.13 and 95.88 | Weekly Target 1 | 87.71 | | Weekly Target 2 | 90.54 | | Weekly Target 3 | 94.463333333333 | | Weekly Target 4 | 97.29 | | Weekly Target 5 | 101.21 |
Weekly price and volumes for Zee Entertainment
| Date |
Closing |
Open |
Range |
Volume |
Wed 10 December 2025 |
93.36 (-4.25%) |
97.58 |
91.64 - 98.39 |
0.6571 times |
Fri 05 December 2025 |
97.50 (-3.91%) |
101.80 |
96.90 - 101.88 |
0.9092 times |
Fri 28 November 2025 |
101.47 (3.48%) |
98.06 |
96.84 - 104.60 |
1.4306 times |
Fri 21 November 2025 |
98.06 (-2.41%) |
100.52 |
97.90 - 101.87 |
0.6209 times |
Fri 14 November 2025 |
100.48 (1.7%) |
99.00 |
96.02 - 104.55 |
1.2362 times |
Fri 07 November 2025 |
98.80 (-1.77%) |
100.69 |
98.05 - 102.88 |
0.6532 times |
Fri 31 October 2025 |
100.58 (-4%) |
104.77 |
100.00 - 105.37 |
1.1998 times |
Fri 24 October 2025 |
104.77 (-0.57%) |
105.53 |
103.54 - 106.71 |
0.7879 times |
Fri 17 October 2025 |
105.37 (-5.43%) |
111.59 |
104.55 - 111.81 |
1.1926 times |
Fri 10 October 2025 |
111.42 (-2.18%) |
114.09 |
108.80 - 114.67 |
1.3125 times |
Fri 03 October 2025 |
113.90 (1.16%) |
112.99 |
111.80 - 115.07 |
0.953 times |
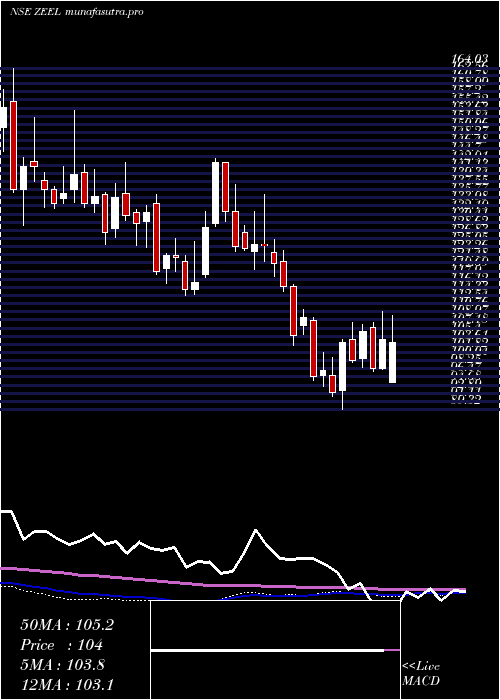
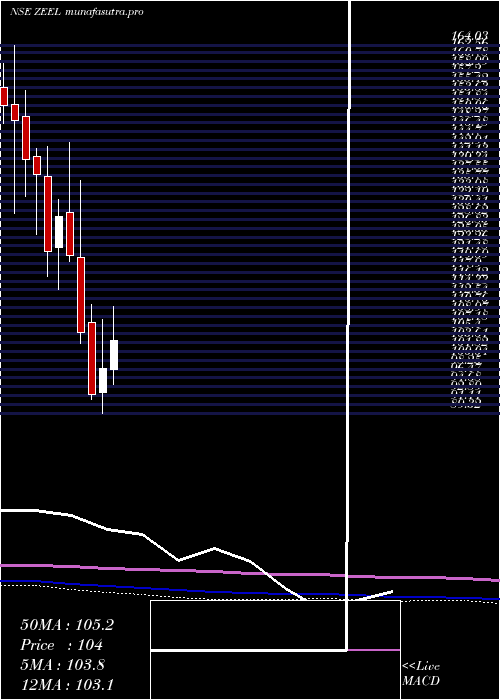
Monthly price and charts ZeeEntertainment Strong monthly Stock price targets for ZeeEntertainment ZEEL are 87.38 and 97.62 | Monthly Target 1 | 85.39 | | Monthly Target 2 | 89.37 | | Monthly Target 3 | 95.626666666667 | | Monthly Target 4 | 99.61 | | Monthly Target 5 | 105.87 |
Monthly price and volumes Zee Entertainment
| Date |
Closing |
Open |
Range |
Volume |
Wed 10 December 2025 |
93.36 (-7.99%) |
101.80 |
91.64 - 101.88 |
0.2078 times |
Fri 28 November 2025 |
101.47 (0.88%) |
100.69 |
96.02 - 104.60 |
0.5229 times |
Fri 31 October 2025 |
100.58 (-10.49%) |
112.57 |
100.00 - 115.07 |
0.6554 times |
Tue 30 September 2025 |
112.37 (-3.16%) |
116.62 |
111.80 - 121.80 |
0.6609 times |
Fri 29 August 2025 |
116.04 (-1.82%) |
118.39 |
111.60 - 124.14 |
0.7764 times |
Thu 31 July 2025 |
118.19 (-19.19%) |
146.50 |
115.12 - 151.70 |
1.5788 times |
Mon 30 June 2025 |
146.25 (12.14%) |
130.79 |
126.09 - 151.44 |
2.1871 times |
Fri 30 May 2025 |
130.42 (22.63%) |
107.00 |
104.50 - 131.70 |
1.0643 times |
Wed 30 April 2025 |
106.35 (8.15%) |
98.26 |
95.15 - 119.85 |
1.0715 times |
Fri 28 March 2025 |
98.34 (5.64%) |
93.50 |
89.32 - 108.36 |
1.275 times |
Fri 28 February 2025 |
93.09 (-11.84%) |
107.76 |
92.11 - 111.35 |
0.732 times |
DMA SMA EMA moving averages of Zee Entertainment ZEEL
DMA (daily moving average) of Zee Entertainment ZEEL
| DMA period | DMA value | | 5 day DMA | 95.02 | | 12 day DMA | 97.27 | | 20 day DMA | 98.06 | | 35 day DMA | 99.7 | | 50 day DMA | 102.93 | | 100 day DMA | 110.92 | | 150 day DMA | 118.5 | | 200 day DMA | 114.83 | EMA (exponential moving average) of Zee Entertainment ZEEL
| EMA period | EMA current | EMA prev | EMA prev2 | | 5 day EMA | 94.74 | 95.43 | 96.78 | | 12 day EMA | 96.6 | 97.19 | 98 | | 20 day EMA | 97.97 | 98.45 | 99.05 | | 35 day EMA | 100.74 | 101.17 | 101.67 | | 50 day EMA | 103.23 | 103.63 | 104.07 |
SMA (simple moving average) of Zee Entertainment ZEEL
| SMA period | SMA current | SMA prev | SMA prev2 | | 5 day SMA | 95.02 | 96.3 | 97.32 | | 12 day SMA | 97.27 | 97.68 | 98.12 | | 20 day SMA | 98.06 | 98.57 | 98.87 | | 35 day SMA | 99.7 | 100 | 100.36 | | 50 day SMA | 102.93 | 103.32 | 103.76 | | 100 day SMA | 110.92 | 111.43 | 111.93 | | 150 day SMA | 118.5 | 118.61 | 118.7 | | 200 day SMA | 114.83 | 114.85 | 114.87 |
|
|
