WS WSI full analysis,charts,indicators,moving averages,SMA,DMA,EMA,ADX,MACD,RSIW S WSI WideScreen charts, DMA,SMA,EMA technical analysis, forecast prediction, by indicators ADX,MACD,RSI,CCI NSE stock exchange
operates under Industrial Machinery sector
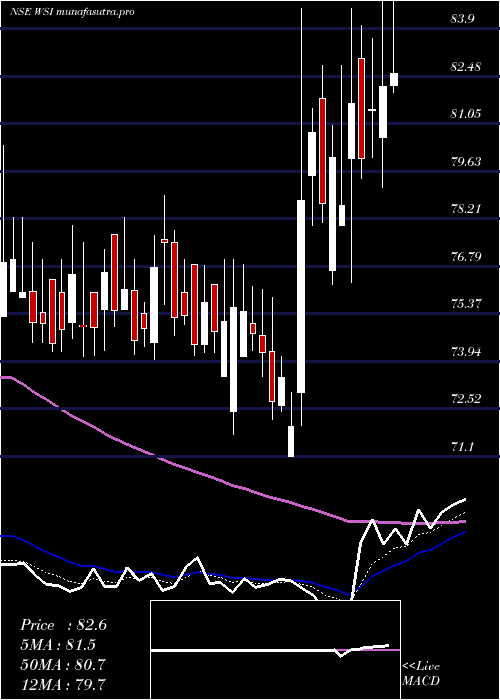
Daily price and charts and targets WS Strong Daily Stock price targets for WS WSI are 82.29 and 92.29 | Daily Target 1 | 75.52 | | Daily Target 2 | 79.05 | | Daily Target 3 | 85.523333333333 | | Daily Target 4 | 89.05 | | Daily Target 5 | 95.52 |
Daily price and volume W S
| Date |
Closing |
Open |
Range |
Volume |
Tue 28 October 2025 |
82.57 (0.5%) |
82.20 |
82.00 - 92.00 |
4.6428 times |
Mon 27 October 2025 |
82.16 (0.85%) |
80.65 |
79.15 - 86.56 |
1.1526 times |
Fri 24 October 2025 |
81.47 (1.84%) |
81.45 |
80.06 - 83.60 |
0.4331 times |
Thu 23 October 2025 |
80.00 (-2.02%) |
83.00 |
79.40 - 84.00 |
0.381 times |
Tue 21 October 2025 |
81.65 (3.85%) |
80.00 |
76.32 - 84.50 |
0.3636 times |
Mon 20 October 2025 |
78.62 (-1.77%) |
78.02 |
78.00 - 82.79 |
0.1166 times |
Fri 17 October 2025 |
80.04 (1.75%) |
76.66 |
76.25 - 81.00 |
0.2747 times |
Thu 16 October 2025 |
78.66 (-2.64%) |
81.80 |
78.11 - 82.80 |
0.1979 times |
Wed 15 October 2025 |
80.79 (2.59%) |
79.50 |
78.00 - 81.50 |
0.6047 times |
Tue 14 October 2025 |
78.75 (9.41%) |
73.00 |
72.01 - 84.50 |
1.8331 times |
Mon 13 October 2025 |
71.98 (-2.01%) |
71.10 |
71.10 - 73.00 |
0.1064 times |
Weekly price and charts WS Strong weekly Stock price targets for WS WSI are 80.86 and 93.71 | Weekly Target 1 | 71.72 | | Weekly Target 2 | 77.15 | | Weekly Target 3 | 84.573333333333 | | Weekly Target 4 | 90 | | Weekly Target 5 | 97.42 |
Weekly price and volumes for W S
| Date |
Closing |
Open |
Range |
Volume |
Tue 28 October 2025 |
82.57 (1.35%) |
80.65 |
79.15 - 92.00 |
2.4866 times |
Fri 24 October 2025 |
81.47 (1.79%) |
78.02 |
76.32 - 84.50 |
0.5553 times |
Fri 17 October 2025 |
80.04 (8.96%) |
71.10 |
71.10 - 84.50 |
1.2943 times |
Fri 10 October 2025 |
73.46 (-2.79%) |
74.10 |
72.21 - 76.85 |
0.377 times |
Fri 03 October 2025 |
75.57 (1.5%) |
74.45 |
71.76 - 77.00 |
0.4411 times |
Fri 26 September 2025 |
74.45 (-0.64%) |
74.50 |
74.00 - 78.90 |
0.7867 times |
Fri 19 September 2025 |
74.93 (-0.03%) |
75.50 |
74.15 - 78.23 |
0.5868 times |
Fri 12 September 2025 |
74.95 (-0.19%) |
76.40 |
74.10 - 77.99 |
1.5358 times |
Fri 05 September 2025 |
75.09 (-2.19%) |
75.30 |
74.50 - 80.41 |
0.6628 times |
Fri 29 August 2025 |
76.77 (-2.17%) |
80.00 |
74.12 - 82.50 |
1.2736 times |
Fri 22 August 2025 |
78.47 (-8.17%) |
89.50 |
76.80 - 90.40 |
1.2158 times |

Monthly price and charts WS Strong monthly Stock price targets for WS WSI are 76.84 and 97.74 | Monthly Target 1 | 60.99 | | Monthly Target 2 | 71.78 | | Monthly Target 3 | 81.89 | | Monthly Target 4 | 92.68 | | Monthly Target 5 | 102.79 |
Monthly price and volumes W S
| Date |
Closing |
Open |
Range |
Volume |
Tue 28 October 2025 |
82.57 (10.34%) |
73.50 |
71.10 - 92.00 |
0.924 times |
Tue 30 September 2025 |
74.83 (-2.53%) |
75.30 |
74.00 - 80.41 |
0.7207 times |
Fri 29 August 2025 |
76.77 (-5.56%) |
73.95 |
62.60 - 98.90 |
1.2487 times |
Wed 19 February 2025 |
81.29 (-20.1%) |
97.65 |
67.00 - 102.25 |
0.8695 times |
Fri 31 January 2025 |
101.74 (-13.11%) |
118.00 |
91.20 - 123.01 |
0.7135 times |
Tue 31 December 2024 |
117.09 (-9.35%) |
129.17 |
110.65 - 136.60 |
0.7579 times |
Fri 29 November 2024 |
129.17 (0.07%) |
131.90 |
105.82 - 143.35 |
1.0521 times |
Thu 31 October 2024 |
129.08 (-12.08%) |
148.50 |
120.88 - 151.30 |
0.7249 times |
Mon 30 September 2024 |
146.81 (-6.37%) |
157.89 |
145.40 - 168.70 |
1.3669 times |
Fri 30 August 2024 |
156.79 (-8.78%) |
174.89 |
147.59 - 174.89 |
1.6217 times |
Wed 31 July 2024 |
171.89 (19.97%) |
143.98 |
143.41 - 185.66 |
5.2103 times |

DMA SMA EMA moving averages of W S WSI
DMA (daily moving average) of W S WSI
| DMA period | DMA value | | 5 day DMA | 81.57 | | 12 day DMA | 79.18 | | 20 day DMA | 77.43 | | 35 day DMA | 76.61 | | 50 day DMA | 77.19 | | 100 day DMA | 90.19 | | 150 day DMA | 103.31 | | 200 day DMA | 116.98 | EMA (exponential moving average) of W S WSI
| EMA period | EMA current | EMA prev | EMA prev2 | | 5 day EMA | 81.46 | 80.91 | 80.28 | | 12 day EMA | 79.72 | 79.2 | 78.66 | | 20 day EMA | 78.63 | 78.22 | 77.8 | | 35 day EMA | 78.05 | 77.78 | 77.52 | | 50 day EMA | 77.87 | 77.68 | 77.5 |
SMA (simple moving average) of W S WSI
| SMA period | SMA current | SMA prev | SMA prev2 | | 5 day SMA | 81.57 | 80.78 | 80.36 | | 12 day SMA | 79.18 | 78.36 | 77.7 | | 20 day SMA | 77.43 | 77.02 | 76.68 | | 35 day SMA | 76.61 | 76.4 | 76.19 | | 50 day SMA | 77.19 | 77.35 | 77.43 | | 100 day SMA | 90.19 | 90.61 | 91 | | 150 day SMA | 103.31 | 103.73 | 104.17 | | 200 day SMA | 116.98 | 117.38 | 117.77 |
|
|
