WindlasBiotech WINDLAS full analysis,charts,indicators,moving averages,SMA,DMA,EMA,ADX,MACD,RSIWindlas Biotech WINDLAS WideScreen charts, DMA,SMA,EMA technical analysis, forecast prediction, by indicators ADX,MACD,RSI,CCI NSE stock exchange
Daily price and charts and targets WindlasBiotech Strong Daily Stock price targets for WindlasBiotech WINDLAS are 916.25 and 936.25 | Daily Target 1 | 911.83 | | Daily Target 2 | 920.67 | | Daily Target 3 | 931.83333333333 | | Daily Target 4 | 940.67 | | Daily Target 5 | 951.83 |
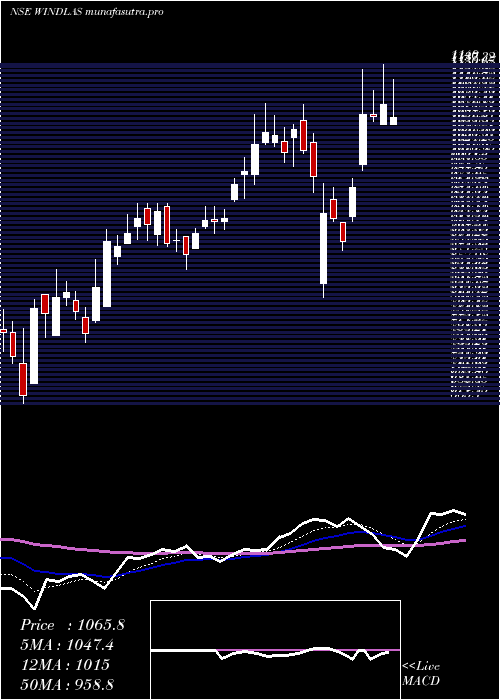
Daily price and volume Windlas Biotech
| Date |
Closing |
Open |
Range |
Volume |
Tue 28 October 2025 |
929.50 (-1.24%) |
941.20 |
923.00 - 943.00 |
0.4825 times |
Mon 27 October 2025 |
941.20 (1.33%) |
937.70 |
925.55 - 943.10 |
0.8398 times |
Fri 24 October 2025 |
928.85 (-1.12%) |
940.00 |
921.50 - 941.95 |
0.9211 times |
Thu 23 October 2025 |
939.35 (-1.26%) |
950.00 |
930.90 - 959.00 |
1.3981 times |
Tue 21 October 2025 |
951.35 (1.13%) |
945.00 |
944.95 - 957.90 |
0.696 times |
Mon 20 October 2025 |
940.75 (1.46%) |
935.50 |
929.00 - 944.75 |
0.8463 times |
Fri 17 October 2025 |
927.20 (0.59%) |
914.30 |
914.30 - 930.60 |
0.6832 times |
Thu 16 October 2025 |
921.75 (0.96%) |
907.65 |
907.65 - 925.55 |
0.6775 times |
Wed 15 October 2025 |
913.00 (-0.35%) |
906.65 |
904.65 - 918.90 |
1.484 times |
Tue 14 October 2025 |
916.25 (0.44%) |
908.00 |
904.65 - 922.55 |
1.9715 times |
Mon 13 October 2025 |
912.20 (-0.26%) |
910.00 |
906.05 - 921.45 |
0.9082 times |
Weekly price and charts WindlasBiotech Strong weekly Stock price targets for WindlasBiotech WINDLAS are 916.2 and 936.3 | Weekly Target 1 | 911.77 | | Weekly Target 2 | 920.63 | | Weekly Target 3 | 931.86666666667 | | Weekly Target 4 | 940.73 | | Weekly Target 5 | 951.97 |
Weekly price and volumes for Windlas Biotech
| Date |
Closing |
Open |
Range |
Volume |
Tue 28 October 2025 |
929.50 (0.07%) |
937.70 |
923.00 - 943.10 |
0.2411 times |
Fri 24 October 2025 |
928.85 (0.18%) |
935.50 |
921.50 - 959.00 |
0.7041 times |
Fri 17 October 2025 |
927.20 (1.38%) |
910.00 |
904.65 - 930.60 |
1.0438 times |
Fri 10 October 2025 |
914.55 (-2.72%) |
940.15 |
904.50 - 949.00 |
1.344 times |
Fri 03 October 2025 |
940.15 (1.89%) |
918.00 |
900.15 - 955.05 |
0.8368 times |
Fri 26 September 2025 |
922.70 (-4.25%) |
973.20 |
916.60 - 973.20 |
1.3657 times |
Fri 19 September 2025 |
963.65 (-2.98%) |
994.25 |
949.00 - 1010.00 |
1.1682 times |
Fri 12 September 2025 |
993.30 (-0.03%) |
993.55 |
985.00 - 1027.50 |
1.2865 times |
Fri 05 September 2025 |
993.60 (-0.48%) |
998.40 |
965.15 - 1012.00 |
1.0509 times |
Fri 29 August 2025 |
998.40 (-1.33%) |
1011.85 |
959.00 - 1020.05 |
0.959 times |
Fri 22 August 2025 |
1011.85 (-3.4%) |
1064.80 |
1007.00 - 1097.90 |
2.572 times |

Monthly price and charts WindlasBiotech Strong monthly Stock price targets for WindlasBiotech WINDLAS are 917 and 971.5 | Monthly Target 1 | 876.5 | | Monthly Target 2 | 903 | | Monthly Target 3 | 931 | | Monthly Target 4 | 957.5 | | Monthly Target 5 | 985.5 |
Monthly price and volumes Windlas Biotech
| Date |
Closing |
Open |
Range |
Volume |
Tue 28 October 2025 |
929.50 (2.61%) |
905.00 |
904.50 - 959.00 |
0.3729 times |
Tue 30 September 2025 |
905.85 (-9.27%) |
998.40 |
900.15 - 1027.50 |
0.532 times |
Fri 29 August 2025 |
998.40 (0.95%) |
999.90 |
907.00 - 1097.90 |
1.3919 times |
Thu 31 July 2025 |
989.05 (11.04%) |
885.00 |
875.00 - 1023.05 |
0.8668 times |
Mon 30 June 2025 |
890.75 (-2.37%) |
909.00 |
865.00 - 961.95 |
0.6216 times |
Fri 30 May 2025 |
912.35 (-5.5%) |
970.40 |
871.05 - 1034.95 |
0.902 times |
Wed 30 April 2025 |
965.50 (-7.21%) |
1032.00 |
813.25 - 1140.00 |
1.1588 times |
Fri 28 March 2025 |
1040.50 (36.37%) |
781.00 |
777.60 - 1085.05 |
1.7195 times |
Fri 28 February 2025 |
763.00 (-21.21%) |
974.05 |
665.10 - 1078.70 |
1.766 times |
Fri 31 January 2025 |
968.35 (-6.99%) |
1048.25 |
833.00 - 1075.00 |
0.6686 times |
Tue 31 December 2024 |
1041.15 (-4.76%) |
1091.90 |
998.00 - 1178.85 |
0.4534 times |

DMA SMA EMA moving averages of Windlas Biotech WINDLAS
DMA (daily moving average) of Windlas Biotech WINDLAS
| DMA period | DMA value | | 5 day DMA | 938.05 | | 12 day DMA | 928 | | 20 day DMA | 924.56 | | 35 day DMA | 944.24 | | 50 day DMA | 963.49 | | 100 day DMA | 945.59 | | 150 day DMA | 956.6 | | 200 day DMA | 945.98 | EMA (exponential moving average) of Windlas Biotech WINDLAS
| EMA period | EMA current | EMA prev | EMA prev2 | | 5 day EMA | 934.11 | 936.42 | 934.03 | | 12 day EMA | 931.69 | 932.09 | 930.43 | | 20 day EMA | 933.73 | 934.18 | 933.44 | | 35 day EMA | 945.29 | 946.22 | 946.52 | | 50 day EMA | 960.29 | 961.55 | 962.38 |
SMA (simple moving average) of Windlas Biotech WINDLAS
| SMA period | SMA current | SMA prev | SMA prev2 | | 5 day SMA | 938.05 | 940.3 | 937.5 | | 12 day SMA | 928 | 926.97 | 924.4 | | 20 day SMA | 924.56 | 924.22 | 923.66 | | 35 day SMA | 944.24 | 946.07 | 947.29 | | 50 day SMA | 963.49 | 966.05 | 966.12 | | 100 day SMA | 945.59 | 945.51 | 945.33 | | 150 day SMA | 956.6 | 956.54 | 956.28 | | 200 day SMA | 945.98 | 946.35 | 946.69 |
|
|
