WheelsIndia WHEELS full analysis,charts,indicators,moving averages,SMA,DMA,EMA,ADX,MACD,RSIWheels India WHEELS WideScreen charts, DMA,SMA,EMA technical analysis, forecast prediction, by indicators ADX,MACD,RSI,CCI NSE stock exchange
Daily price and charts and targets WheelsIndia Strong Daily Stock price targets for WheelsIndia WHEELS are 910.38 and 938.88 | Daily Target 1 | 904.62 | | Daily Target 2 | 916.13 | | Daily Target 3 | 933.11666666667 | | Daily Target 4 | 944.63 | | Daily Target 5 | 961.62 |
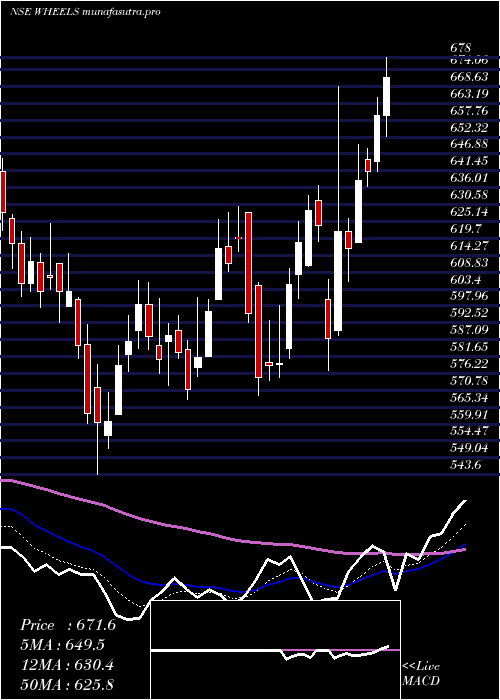
Daily price and volume Wheels India
| Date |
Closing |
Open |
Range |
Volume |
Tue 28 October 2025 |
927.65 (-1%) |
944.00 |
921.60 - 950.10 |
0.8052 times |
Mon 27 October 2025 |
937.05 (-1.1%) |
942.95 |
930.00 - 946.10 |
0.9072 times |
Fri 24 October 2025 |
947.45 (0.31%) |
945.10 |
935.40 - 959.70 |
0.9989 times |
Thu 23 October 2025 |
944.55 (-1.63%) |
971.00 |
940.00 - 978.50 |
1.9794 times |
Tue 21 October 2025 |
960.20 (3.5%) |
939.00 |
937.00 - 965.00 |
1.2135 times |
Mon 20 October 2025 |
927.75 (1.84%) |
919.90 |
901.00 - 937.00 |
1.4298 times |
Fri 17 October 2025 |
911.00 (-0.96%) |
923.50 |
907.00 - 923.50 |
0.4948 times |
Thu 16 October 2025 |
919.80 (-1.23%) |
937.00 |
911.15 - 937.00 |
0.6095 times |
Wed 15 October 2025 |
931.25 (0.69%) |
930.00 |
915.20 - 935.35 |
0.8027 times |
Tue 14 October 2025 |
924.85 (-0.31%) |
938.00 |
905.00 - 938.00 |
0.7591 times |
Mon 13 October 2025 |
927.70 (-0.99%) |
936.00 |
925.05 - 945.70 |
0.9442 times |
Weekly price and charts WheelsIndia Strong weekly Stock price targets for WheelsIndia WHEELS are 910.38 and 938.88 | Weekly Target 1 | 904.62 | | Weekly Target 2 | 916.13 | | Weekly Target 3 | 933.11666666667 | | Weekly Target 4 | 944.63 | | Weekly Target 5 | 961.62 |
Weekly price and volumes for Wheels India
| Date |
Closing |
Open |
Range |
Volume |
Tue 28 October 2025 |
927.65 (-2.09%) |
942.95 |
921.60 - 950.10 |
0.2084 times |
Fri 24 October 2025 |
947.45 (4%) |
919.90 |
901.00 - 978.50 |
0.6843 times |
Fri 17 October 2025 |
911.00 (-2.77%) |
936.00 |
905.00 - 945.70 |
0.4394 times |
Fri 10 October 2025 |
937.00 (6.86%) |
884.40 |
851.55 - 957.00 |
1.9826 times |
Fri 03 October 2025 |
876.85 (1.55%) |
880.80 |
865.20 - 933.00 |
1.6113 times |
Fri 26 September 2025 |
863.50 (6.97%) |
802.30 |
791.45 - 911.95 |
4.0762 times |
Fri 19 September 2025 |
807.25 (8.7%) |
740.00 |
737.05 - 828.80 |
0.6337 times |
Fri 12 September 2025 |
742.65 (1.43%) |
734.10 |
730.45 - 759.00 |
0.1497 times |
Fri 05 September 2025 |
732.15 (-0.12%) |
726.00 |
722.00 - 753.00 |
0.1384 times |
Fri 29 August 2025 |
733.00 (-2.9%) |
750.00 |
730.00 - 765.00 |
0.0759 times |
Fri 22 August 2025 |
754.90 (5.13%) |
724.50 |
719.95 - 776.00 |
0.2111 times |

Monthly price and charts WheelsIndia Strong monthly Stock price targets for WheelsIndia WHEELS are 889.6 and 1016.55 | Monthly Target 1 | 792.28 | | Monthly Target 2 | 859.97 | | Monthly Target 3 | 919.23333333333 | | Monthly Target 4 | 986.92 | | Monthly Target 5 | 1046.18 |
Monthly price and volumes Wheels India
| Date |
Closing |
Open |
Range |
Volume |
Tue 28 October 2025 |
927.65 (2.63%) |
908.00 |
851.55 - 978.50 |
1.925 times |
Tue 30 September 2025 |
903.90 (23.32%) |
726.00 |
722.00 - 933.00 |
3.1226 times |
Fri 29 August 2025 |
733.00 (-4.15%) |
760.00 |
712.45 - 795.05 |
0.4053 times |
Thu 31 July 2025 |
764.70 (-6.02%) |
821.85 |
756.00 - 851.00 |
0.7997 times |
Mon 30 June 2025 |
813.70 (9.98%) |
732.20 |
722.70 - 846.65 |
0.8226 times |
Fri 30 May 2025 |
739.85 (9.33%) |
670.00 |
634.05 - 804.95 |
0.6719 times |
Wed 30 April 2025 |
676.70 (16.77%) |
584.15 |
577.05 - 716.50 |
0.5129 times |
Fri 28 March 2025 |
579.50 (2.86%) |
571.55 |
543.60 - 629.90 |
0.6847 times |
Fri 28 February 2025 |
563.40 (-19.54%) |
699.95 |
560.00 - 708.00 |
0.3003 times |
Fri 31 January 2025 |
700.25 (3.69%) |
678.10 |
645.00 - 760.00 |
0.7551 times |
Tue 31 December 2024 |
675.30 (-6.42%) |
721.65 |
661.15 - 776.00 |
0.3549 times |

DMA SMA EMA moving averages of Wheels India WHEELS
DMA (daily moving average) of Wheels India WHEELS
| DMA period | DMA value | | 5 day DMA | 943.38 | | 12 day DMA | 933.02 | | 20 day DMA | 918.02 | | 35 day DMA | 865.62 | | 50 day DMA | 827.41 | | 100 day DMA | 800.9 | | 150 day DMA | 760.43 | | 200 day DMA | 730.69 | EMA (exponential moving average) of Wheels India WHEELS
| EMA period | EMA current | EMA prev | EMA prev2 | | 5 day EMA | 935.75 | 939.8 | 941.17 | | 12 day EMA | 927.52 | 927.5 | 925.76 | | 20 day EMA | 909.68 | 907.79 | 904.71 | | 35 day EMA | 872.04 | 868.77 | 864.75 | | 50 day EMA | 830.57 | 826.61 | 822.1 |
SMA (simple moving average) of Wheels India WHEELS
| SMA period | SMA current | SMA prev | SMA prev2 | | 5 day SMA | 943.38 | 943.4 | 938.19 | | 12 day SMA | 933.02 | 933.97 | 932.58 | | 20 day SMA | 918.02 | 914.81 | 911.51 | | 35 day SMA | 865.62 | 860.03 | 854.32 | | 50 day SMA | 827.41 | 823.28 | 819.12 | | 100 day SMA | 800.9 | 799.07 | 797.1 | | 150 day SMA | 760.43 | 758.22 | 755.85 | | 200 day SMA | 730.69 | 729.58 | 728.62 |
|
|
