WeworkIndia WEWORK full analysis,charts,indicators,moving averages,SMA,DMA,EMA,ADX,MACD,RSIWework India WEWORK WideScreen charts, DMA,SMA,EMA technical analysis, forecast prediction, by indicators ADX,MACD,RSI,CCI NSE stock exchange
Daily price and charts and targets WeworkIndia Strong Daily Stock price targets for WeworkIndia WEWORK are 639.68 and 654.58 | Daily Target 1 | 627.52 | | Daily Target 2 | 636.93 | | Daily Target 3 | 642.41666666667 | | Daily Target 4 | 651.83 | | Daily Target 5 | 657.32 |
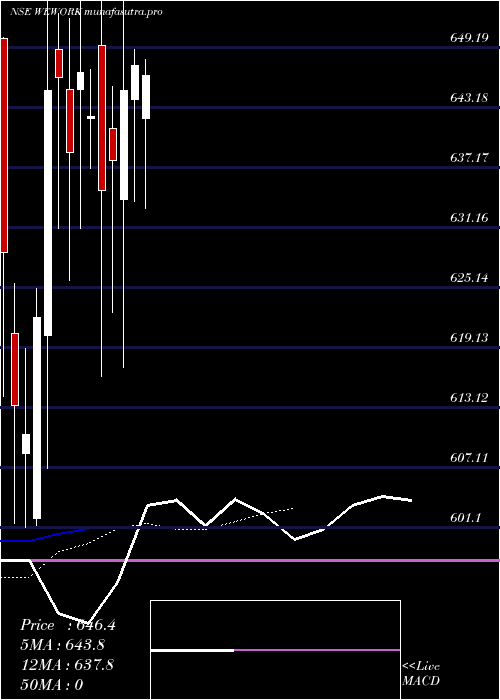
Daily price and volume Wework India
| Date |
Closing |
Open |
Range |
Volume |
Thu 30 October 2025 |
646.35 (-0.15%) |
642.00 |
633.00 - 647.90 |
0.4963 times |
Wed 29 October 2025 |
647.35 (0.39%) |
643.90 |
633.80 - 649.00 |
0.6064 times |
Tue 28 October 2025 |
644.85 (1.11%) |
634.00 |
617.10 - 653.80 |
0.9257 times |
Mon 27 October 2025 |
637.80 (0.47%) |
641.00 |
622.60 - 645.25 |
0.5904 times |
Fri 24 October 2025 |
634.80 (-1.17%) |
649.30 |
616.25 - 654.60 |
1.2387 times |
Thu 23 October 2025 |
642.30 (-0.67%) |
642.00 |
637.05 - 647.00 |
0.4909 times |
Tue 21 October 2025 |
646.60 (1.24%) |
645.00 |
631.00 - 655.00 |
0.3701 times |
Mon 20 October 2025 |
638.70 (-1.16%) |
644.90 |
625.80 - 652.00 |
0.9199 times |
Fri 17 October 2025 |
646.20 (0.21%) |
649.00 |
631.00 - 652.50 |
1.2098 times |
Thu 16 October 2025 |
644.85 (3.65%) |
620.30 |
607.00 - 655.00 |
3.1519 times |
Wed 15 October 2025 |
622.15 (1.92%) |
602.00 |
601.25 - 625.00 |
0.9514 times |
Weekly price and charts WeworkIndia Strong weekly Stock price targets for WeworkIndia WEWORK are 631.73 and 668.43 | Weekly Target 1 | 602.38 | | Weekly Target 2 | 624.37 | | Weekly Target 3 | 639.08333333333 | | Weekly Target 4 | 661.07 | | Weekly Target 5 | 675.78 |
Weekly price and volumes for Wework India
| Date |
Closing |
Open |
Range |
Volume |
Thu 30 October 2025 |
646.35 (1.82%) |
641.00 |
617.10 - 653.80 |
0.3692 times |
Fri 24 October 2025 |
634.80 (-1.76%) |
644.90 |
616.25 - 655.00 |
0.4257 times |
Fri 17 October 2025 |
646.20 (0%) |
620.50 |
601.10 - 655.00 |
2.2051 times |
Thu 30 October 2025 |
(0%) |
|
- |
0 times |

Monthly price and charts WeworkIndia Strong monthly Stock price targets for WeworkIndia WEWORK are 596.78 and 650.68 | Monthly Target 1 | 580.25 | | Monthly Target 2 | 613.3 | | Monthly Target 3 | 634.15 | | Monthly Target 4 | 667.2 | | Monthly Target 5 | 688.05 |
Monthly price and volumes Wework India
| Date |
Closing |
Open |
Range |
Volume |
Thu 30 October 2025 |
646.35 (0%) |
650.00 |
601.10 - 655.00 |
1 times |
Thu 30 October 2025 |
(0%) |
|
- |
0 times |

DMA SMA EMA moving averages of Wework India WEWORK
DMA (daily moving average) of Wework India WEWORK
| DMA period | DMA value | | 5 day DMA | 642.23 | | 12 day DMA | 638.53 | | 20 day DMA | | | 35 day DMA | | | 50 day DMA | | | 100 day DMA | | | 150 day DMA | | | 200 day DMA | | EMA (exponential moving average) of Wework India WEWORK
| EMA period | EMA current | EMA prev | EMA prev2 | | 5 day EMA | 643.84 | 642.58 | 640.2 | | 12 day EMA | 637.79 | 636.23 | 634.21 | | 20 day EMA | 0 | 0 | 0 | | 35 day EMA | 0 | 0 | 0 | | 50 day EMA | 0 | 0 | 0 |
SMA (simple moving average) of Wework India WEWORK
| SMA period | SMA current | SMA prev | SMA prev2 | | 5 day SMA | 642.23 | 641.42 | 641.27 | | 12 day SMA | 638.53 | | 20 day SMA | | 35 day SMA | | 50 day SMA | | 100 day SMA | | 150 day SMA | | 200 day SMA |
|
|
