WelspunInvestments WELINV full analysis,charts,indicators,moving averages,SMA,DMA,EMA,ADX,MACD,RSIWelspun Investments WELINV WideScreen charts, DMA,SMA,EMA technical analysis, forecast prediction, by indicators ADX,MACD,RSI,CCI NSE stock exchange
operates under Other Financial Services sector
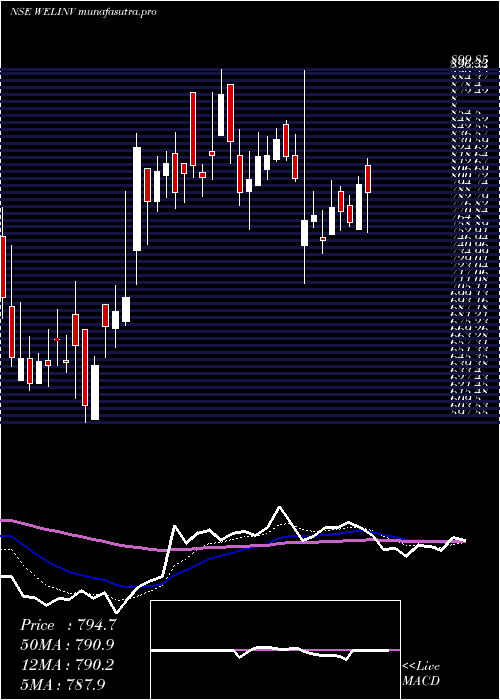
Daily price and charts and targets WelspunInvestments Strong Daily Stock price targets for WelspunInvestments WELINV are 781.85 and 827.25 | Daily Target 1 | 745.1 | | Daily Target 2 | 773.2 | | Daily Target 3 | 790.5 | | Daily Target 4 | 818.6 | | Daily Target 5 | 835.9 |
Daily price and volume Welspun Investments
| Date |
Closing |
Open |
Range |
Volume |
Thu 17 April 2025 |
801.30 (4.22%) |
762.40 |
762.40 - 807.80 |
0.188 times |
Wed 16 April 2025 |
768.85 (-1.17%) |
783.45 |
765.10 - 791.95 |
0.3102 times |
Tue 15 April 2025 |
777.95 (-0.42%) |
795.60 |
762.00 - 800.00 |
0.2529 times |
Fri 11 April 2025 |
781.20 (3.73%) |
758.45 |
758.40 - 805.00 |
0.5322 times |
Wed 09 April 2025 |
753.10 (-2.76%) |
755.55 |
742.00 - 778.85 |
0.1174 times |
Tue 08 April 2025 |
774.50 (0.52%) |
769.45 |
764.55 - 795.40 |
0.075 times |
Mon 07 April 2025 |
770.50 (-4.43%) |
748.95 |
716.40 - 899.00 |
0.5503 times |
Fri 04 April 2025 |
806.20 (-2.36%) |
826.05 |
803.50 - 843.95 |
0.184 times |
Thu 03 April 2025 |
825.65 (-1.71%) |
852.35 |
822.00 - 855.95 |
0.7935 times |
Wed 02 April 2025 |
840.00 (1.73%) |
822.90 |
821.05 - 848.90 |
6.9965 times |
Tue 01 April 2025 |
825.75 (0.04%) |
814.55 |
805.60 - 842.10 |
0.2109 times |
Weekly price and charts WelspunInvestments Strong weekly Stock price targets for WelspunInvestments WELINV are 781.65 and 827.45 | Weekly Target 1 | 744.57 | | Weekly Target 2 | 772.93 | | Weekly Target 3 | 790.36666666667 | | Weekly Target 4 | 818.73 | | Weekly Target 5 | 836.17 |
Weekly price and volumes for Welspun Investments
| Date |
Closing |
Open |
Range |
Volume |
Thu 17 April 2025 |
801.30 (2.57%) |
795.60 |
762.00 - 807.80 |
0.0797 times |
Fri 11 April 2025 |
781.20 (-3.1%) |
748.95 |
716.40 - 899.00 |
0.1353 times |
Fri 04 April 2025 |
806.20 (-2.33%) |
814.55 |
803.50 - 855.95 |
0.8685 times |
Fri 28 March 2025 |
825.45 (-0.07%) |
843.70 |
762.40 - 899.85 |
0.531 times |
Fri 21 March 2025 |
826.00 (0.84%) |
828.00 |
780.45 - 880.30 |
0.6877 times |
Thu 13 March 2025 |
819.15 (16.29%) |
744.40 |
715.50 - 845.25 |
2.7194 times |
Fri 07 March 2025 |
704.40 (6.16%) |
676.85 |
597.55 - 794.95 |
3.6031 times |
Fri 28 February 2025 |
663.55 (2.13%) |
650.35 |
618.05 - 718.00 |
0.7031 times |
Fri 21 February 2025 |
649.70 (-13.79%) |
757.10 |
625.00 - 781.95 |
0.3191 times |
Fri 14 February 2025 |
753.60 (-19.02%) |
960.00 |
732.00 - 960.00 |
0.3529 times |
Fri 07 February 2025 |
930.60 (20.12%) |
875.10 |
825.10 - 940.00 |
0.2407 times |

Monthly price and charts WelspunInvestments Strong monthly Stock price targets for WelspunInvestments WELINV are 667.55 and 850.15 | Monthly Target 1 | 622.97 | | Monthly Target 2 | 712.13 | | Monthly Target 3 | 805.56666666667 | | Monthly Target 4 | 894.73 | | Monthly Target 5 | 988.17 |
Monthly price and volumes Welspun Investments
| Date |
Closing |
Open |
Range |
Volume |
Thu 17 April 2025 |
801.30 (-2.93%) |
814.55 |
716.40 - 899.00 |
0.4687 times |
Fri 28 March 2025 |
825.45 (24.4%) |
676.85 |
597.55 - 899.85 |
3.262 times |
Fri 28 February 2025 |
663.55 (-14.35%) |
875.10 |
618.05 - 960.00 |
0.6989 times |
Fri 31 January 2025 |
774.75 (-13.95%) |
912.95 |
720.00 - 959.95 |
1.2821 times |
Tue 31 December 2024 |
900.40 (-0.85%) |
932.15 |
865.25 - 1094.00 |
1.3969 times |
Fri 29 November 2024 |
908.15 (-5.4%) |
960.00 |
832.70 - 1046.15 |
0.4597 times |
Thu 31 October 2024 |
959.95 (0.21%) |
1008.90 |
880.05 - 1054.70 |
0.674 times |
Mon 30 September 2024 |
957.90 (-8.75%) |
1077.00 |
932.80 - 1097.90 |
0.3637 times |
Fri 30 August 2024 |
1049.75 (28.5%) |
795.65 |
795.65 - 1124.00 |
1.1275 times |
Wed 31 July 2024 |
816.90 (2.36%) |
829.95 |
755.15 - 858.80 |
0.2666 times |
Fri 28 June 2024 |
798.10 (8.37%) |
736.50 |
695.00 - 818.75 |
0.2713 times |

DMA SMA EMA moving averages of Welspun Investments WELINV
DMA (daily moving average) of Welspun Investments WELINV
| DMA period | DMA value | | 5 day DMA | 776.48 | | 12 day DMA | 795.87 | | 20 day DMA | 806.45 | | 35 day DMA | 765.25 | | 50 day DMA | 774.2 | | 100 day DMA | 822.28 | | 150 day DMA | 872.26 | | 200 day DMA | 872.74 | EMA (exponential moving average) of Welspun Investments WELINV
| EMA period | EMA current | EMA prev | EMA prev2 | | 5 day EMA | 784.49 | 776.08 | 779.7 | | 12 day EMA | 789.4 | 787.24 | 790.58 | | 20 day EMA | 789.69 | 788.47 | 790.53 | | 35 day EMA | 785.32 | 784.38 | 785.29 | | 50 day EMA | 772.97 | 771.81 | 771.93 |
SMA (simple moving average) of Welspun Investments WELINV
| SMA period | SMA current | SMA prev | SMA prev2 | | 5 day SMA | 776.48 | 771.12 | 771.45 | | 12 day SMA | 795.87 | 796.19 | 798.3 | | 20 day SMA | 806.45 | 806.09 | 808.6 | | 35 day SMA | 765.25 | 760.37 | 757.03 | | 50 day SMA | 774.2 | 774.12 | 773.59 | | 100 day SMA | 822.28 | 823.12 | 824.58 | | 150 day SMA | 872.26 | 873.82 | 875.83 | | 200 day SMA | 872.74 | 872.63 | 872.71 |
|
|
