WalchandnagarIndustries WALCHANNAG_BE full analysis,charts,indicators,moving averages,SMA,DMA,EMA,ADX,MACD,RSIWalchandnagar Industries WALCHANNAG_BE WideScreen charts, DMA,SMA,EMA technical analysis, forecast prediction, by indicators ADX,MACD,RSI,CCI NSE stock exchange
Daily price and charts and targets WalchandnagarIndustries Strong Daily Stock price targets for WalchandnagarIndustries WALCHANNAG_BE are 208.96 and 213.29 | Daily Target 1 | 207.9 | | Daily Target 2 | 210.01 | | Daily Target 3 | 212.22666666667 | | Daily Target 4 | 214.34 | | Daily Target 5 | 216.56 |
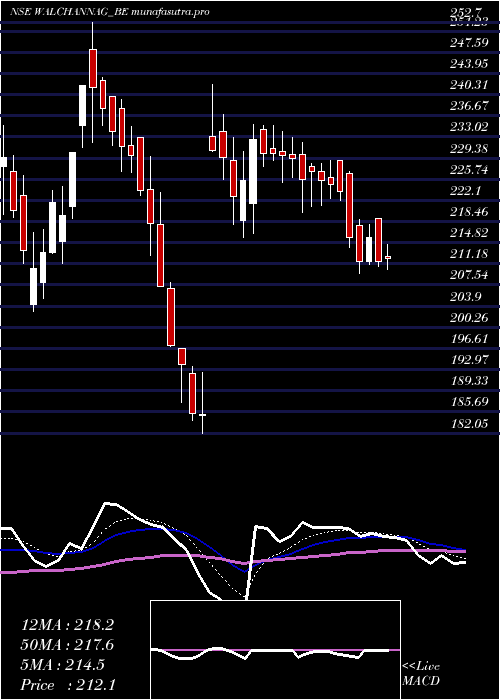
Daily price and volume Walchandnagar Industries
| Date |
Closing |
Open |
Range |
Volume |
Fri 11 July 2025 |
212.13 (0.27%) |
212.40 |
210.11 - 214.44 |
0.7025 times |
Thu 10 July 2025 |
211.55 (-1.96%) |
218.90 |
210.80 - 218.90 |
1.0301 times |
Wed 09 July 2025 |
215.77 (1.96%) |
211.63 |
211.00 - 218.00 |
0.4425 times |
Tue 08 July 2025 |
211.63 (-1.92%) |
217.80 |
209.55 - 218.75 |
1.4293 times |
Mon 07 July 2025 |
215.77 (-3.51%) |
226.70 |
214.00 - 227.00 |
1.6176 times |
Fri 04 July 2025 |
223.61 (-0.53%) |
228.95 |
222.10 - 229.00 |
0.5682 times |
Thu 03 July 2025 |
224.81 (-0.28%) |
226.00 |
222.50 - 229.00 |
0.9417 times |
Wed 02 July 2025 |
225.44 (-0.71%) |
227.06 |
221.15 - 228.50 |
0.8632 times |
Tue 01 July 2025 |
227.06 (0.64%) |
227.88 |
221.00 - 228.50 |
1.0047 times |
Mon 30 June 2025 |
225.62 (-1.63%) |
229.95 |
220.05 - 232.00 |
1.4002 times |
Fri 27 June 2025 |
229.35 (-0.18%) |
230.02 |
226.00 - 232.90 |
0.9519 times |
Weekly price and charts WalchandnagarIndustries Strong weekly Stock price targets for WalchandnagarIndustries WALCHANNAG_BE are 202.12 and 219.57 | Weekly Target 1 | 198.78 | | Weekly Target 2 | 205.45 | | Weekly Target 3 | 216.22666666667 | | Weekly Target 4 | 222.9 | | Weekly Target 5 | 233.68 |
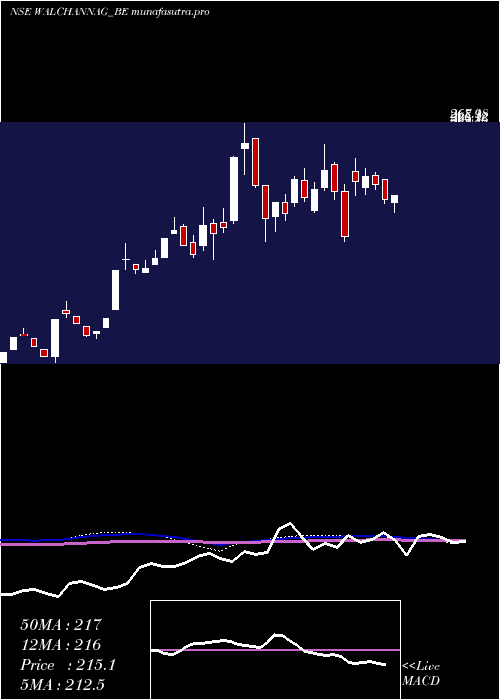
Weekly price and volumes for Walchandnagar Industries
| Date |
Closing |
Open |
Range |
Volume |
Fri 11 July 2025 |
212.13 (-5.13%) |
226.70 |
209.55 - 227.00 |
0.7304 times |
Fri 04 July 2025 |
223.61 (-2.5%) |
229.95 |
220.05 - 232.00 |
0.6683 times |
Fri 27 June 2025 |
229.35 (1.71%) |
221.51 |
216.32 - 235.17 |
1.1532 times |
Fri 20 June 2025 |
225.49 (21.75%) |
233.00 |
215.65 - 242.10 |
1.0721 times |
Fri 10 May 2024 |
185.20 (-15.1%) |
218.00 |
182.05 - 223.50 |
1.9908 times |
Fri 03 May 2024 |
218.15 (-6.77%) |
237.95 |
212.60 - 239.50 |
0.5685 times |
Fri 26 April 2024 |
234.00 (6.63%) |
221.00 |
219.00 - 252.70 |
1.288 times |
Fri 19 April 2024 |
219.45 (2.76%) |
204.10 |
202.90 - 224.50 |
0.7326 times |
Fri 12 April 2024 |
213.55 (-5.86%) |
226.50 |
211.20 - 235.00 |
1.0367 times |
Fri 05 April 2024 |
226.85 (12.14%) |
209.90 |
207.50 - 229.35 |
0.7594 times |
Thu 28 March 2024 |
202.30 (-3.71%) |
209.90 |
197.15 - 216.00 |
0.6211 times |
Monthly price and charts WalchandnagarIndustries Strong monthly Stock price targets for WalchandnagarIndustries WALCHANNAG_BE are 201.12 and 220.57 | Monthly Target 1 | 197.44 | | Monthly Target 2 | 204.79 | | Monthly Target 3 | 216.89333333333 | | Monthly Target 4 | 224.24 | | Monthly Target 5 | 236.34 |
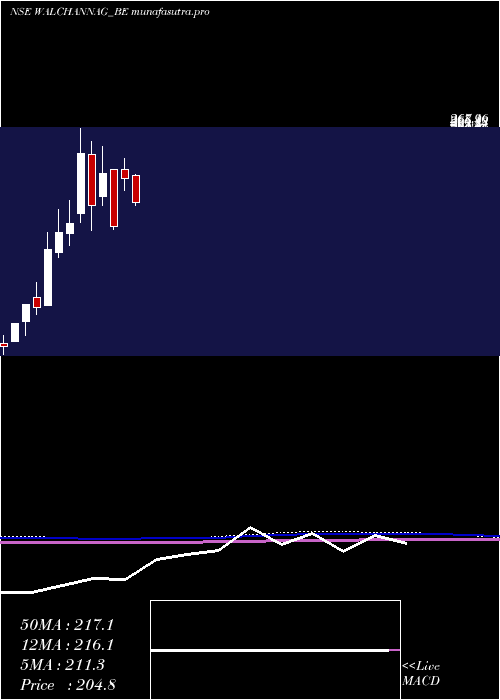
Monthly price and volumes Walchandnagar Industries
| Date |
Closing |
Open |
Range |
Volume |
Fri 11 July 2025 |
212.13 (-5.98%) |
227.88 |
209.55 - 229.00 |
0.3111 times |
Mon 30 June 2025 |
225.62 (21.83%) |
233.00 |
215.65 - 242.10 |
0.6261 times |
Fri 10 May 2024 |
185.20 (-19.39%) |
232.95 |
182.05 - 232.95 |
0.6058 times |
Tue 30 April 2024 |
229.75 (13.57%) |
209.90 |
202.90 - 252.70 |
1.0431 times |
Thu 28 March 2024 |
202.30 (-17.91%) |
245.95 |
181.65 - 256.70 |
0.9724 times |
Thu 29 February 2024 |
246.45 (31.37%) |
195.90 |
188.50 - 268.10 |
1.3703 times |
Fri 22 December 2023 |
187.60 (4.43%) |
179.00 |
168.45 - 206.90 |
0.8512 times |
Thu 30 November 2023 |
179.65 (8.62%) |
163.00 |
158.85 - 198.95 |
0.6209 times |
Tue 31 October 2023 |
165.40 (42.34%) |
118.50 |
118.50 - 180.15 |
1.8271 times |
Fri 29 September 2023 |
116.20 (-2.27%) |
124.80 |
110.85 - 137.55 |
1.772 times |
Thu 31 August 2023 |
118.90 (15.66%) |
104.85 |
93.05 - 118.90 |
2.0323 times |
DMA SMA EMA moving averages of Walchandnagar Industries WALCHANNAG_BE
DMA (daily moving average) of Walchandnagar Industries WALCHANNAG_BE
| DMA period | DMA value | | 5 day DMA | 213.37 | | 12 day DMA | 221.04 | | 20 day DMA | 221.93 | | 35 day DMA | 221.49 | | 50 day DMA | 219.79 | | 100 day DMA | 211.85 | | 150 day DMA | 190.74 | | 200 day DMA | 168.52 | EMA (exponential moving average) of Walchandnagar Industries WALCHANNAG_BE
| EMA period | EMA current | EMA prev | EMA prev2 | | 5 day EMA | 214.46 | 215.62 | 217.66 | | 12 day EMA | 218.15 | 219.25 | 220.65 | | 20 day EMA | 219.24 | 219.99 | 220.88 | | 35 day EMA | 219.2 | 219.62 | 220.09 | | 50 day EMA | 217.27 | 217.48 | 217.72 |
SMA (simple moving average) of Walchandnagar Industries WALCHANNAG_BE
| SMA period | SMA current | SMA prev | SMA prev2 | | 5 day SMA | 213.37 | 215.67 | 218.32 | | 12 day SMA | 221.04 | 222.54 | 224.08 | | 20 day SMA | 221.93 | 220.59 | 219.7 | | 35 day SMA | 221.49 | 221.52 | 221.48 | | 50 day SMA | 219.79 | 219.55 | 219.13 | | 100 day SMA | 211.85 | 211.64 | 211.4 | | 150 day SMA | 190.74 | 190.21 | 189.7 | | 200 day SMA | 168.52 | 167.88 | 167.25 |
|
|
