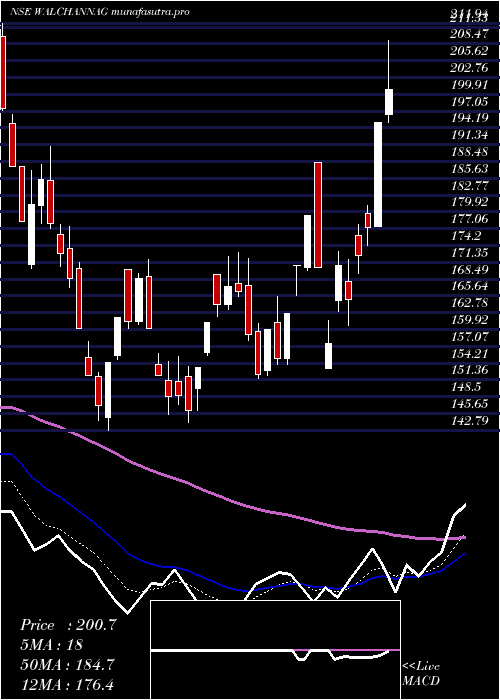
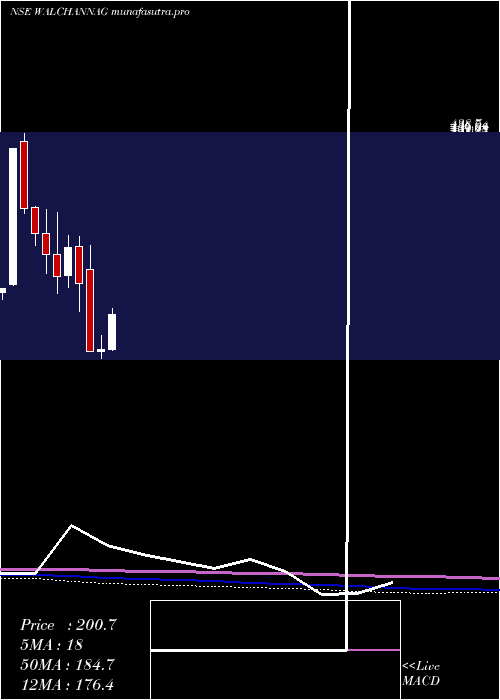
WalchandnagarIndustries WALCHANNAG full analysis,charts,indicators,moving averages,SMA,DMA,EMA,ADX,MACD,RSIWalchandnagar Industries WALCHANNAG WideScreen charts, DMA,SMA,EMA technical analysis, forecast prediction, by indicators ADX,MACD,RSI,CCI NSE stock exchange
operates under Construction & Engineering sector
Daily price and charts and targets WalchandnagarIndustries Strong Daily Stock price targets for WalchandnagarIndustries WALCHANNAG are 164.65 and 169.36 | Daily Target 1 | 163.69 | | Daily Target 2 | 165.6 | | Daily Target 3 | 168.4 | | Daily Target 4 | 170.31 | | Daily Target 5 | 173.11 |
Daily price and volume Walchandnagar Industries
| Date |
Closing |
Open |
Range |
Volume |
Tue 28 October 2025 |
167.51 (-0.91%) |
169.06 |
166.49 - 171.20 |
0.51 times |
Mon 27 October 2025 |
169.05 (-1.41%) |
172.00 |
168.15 - 173.22 |
0.4516 times |
Fri 24 October 2025 |
171.47 (0.69%) |
171.90 |
169.20 - 173.00 |
0.6166 times |
Thu 23 October 2025 |
170.29 (-1.01%) |
173.37 |
170.10 - 175.69 |
0.5881 times |
Tue 21 October 2025 |
172.03 (0.72%) |
171.35 |
170.81 - 176.82 |
0.66 times |
Mon 20 October 2025 |
170.80 (4.04%) |
168.90 |
163.94 - 177.90 |
1.9088 times |
Fri 17 October 2025 |
164.17 (-4.59%) |
172.40 |
163.10 - 174.71 |
1.406 times |
Thu 16 October 2025 |
172.06 (0.22%) |
172.90 |
170.71 - 176.00 |
0.8804 times |
Wed 15 October 2025 |
171.68 (-2.86%) |
176.90 |
170.10 - 178.69 |
1.8161 times |
Tue 14 October 2025 |
176.73 (-3.91%) |
183.93 |
175.00 - 187.77 |
1.1623 times |
Mon 13 October 2025 |
183.93 (-5.53%) |
190.00 |
183.10 - 191.99 |
1.3192 times |
Weekly price and charts WalchandnagarIndustries Strong weekly Stock price targets for WalchandnagarIndustries WALCHANNAG are 163.64 and 170.37 | Weekly Target 1 | 162.34 | | Weekly Target 2 | 164.93 | | Weekly Target 3 | 169.07333333333 | | Weekly Target 4 | 171.66 | | Weekly Target 5 | 175.8 |
Weekly price and volumes for Walchandnagar Industries
| Date |
Closing |
Open |
Range |
Volume |
Tue 28 October 2025 |
167.51 (-2.31%) |
172.00 |
166.49 - 173.22 |
0.1056 times |
Fri 24 October 2025 |
171.47 (4.45%) |
168.90 |
163.94 - 177.90 |
0.4144 times |
Fri 17 October 2025 |
164.17 (-15.68%) |
190.00 |
163.10 - 191.99 |
0.723 times |
Fri 10 October 2025 |
194.69 (-0.1%) |
195.05 |
191.61 - 209.50 |
0.5343 times |
Fri 03 October 2025 |
194.88 (3.16%) |
193.70 |
184.00 - 199.90 |
0.2135 times |
Fri 26 September 2025 |
188.91 (-9.47%) |
208.40 |
187.14 - 213.79 |
0.3131 times |
Fri 19 September 2025 |
208.66 (-2.4%) |
214.00 |
205.81 - 221.00 |
0.443 times |
Fri 12 September 2025 |
213.79 (-11.57%) |
241.60 |
190.00 - 246.84 |
1.0608 times |
Fri 13 June 2025 |
241.77 (-3.7%) |
253.70 |
235.10 - 277.75 |
3.2136 times |
Fri 06 June 2025 |
251.07 (6.69%) |
236.89 |
221.50 - 263.23 |
2.9787 times |
Fri 30 May 2025 |
235.32 (16.22%) |
203.35 |
201.97 - 239.00 |
2.5743 times |

Monthly price and charts WalchandnagarIndustries Strong monthly Stock price targets for WalchandnagarIndustries WALCHANNAG are 142.11 and 188.51 | Monthly Target 1 | 133.64 | | Monthly Target 2 | 150.57 | | Monthly Target 3 | 180.03666666667 | | Monthly Target 4 | 196.97 | | Monthly Target 5 | 226.44 |
Monthly price and volumes Walchandnagar Industries
| Date |
Closing |
Open |
Range |
Volume |
Tue 28 October 2025 |
167.51 (-10.94%) |
188.00 |
163.10 - 209.50 |
0.3825 times |
Tue 30 September 2025 |
188.08 (-22.49%) |
190.00 |
184.00 - 221.00 |
0.2868 times |
Mon 16 June 2025 |
242.66 (3.12%) |
236.89 |
221.50 - 277.75 |
1.3641 times |
Fri 30 May 2025 |
235.32 (30.14%) |
182.39 |
170.00 - 239.00 |
1.8003 times |
Wed 30 April 2025 |
180.82 (16.7%) |
155.00 |
153.34 - 209.00 |
1.2978 times |
Fri 28 March 2025 |
154.94 (1.87%) |
151.90 |
142.79 - 173.01 |
1.1328 times |
Fri 28 February 2025 |
152.10 (-37.11%) |
260.00 |
152.10 - 291.00 |
0.7329 times |
Fri 31 January 2025 |
241.85 (-16.17%) |
289.75 |
205.00 - 303.00 |
0.781 times |
Tue 31 December 2024 |
288.50 (14.87%) |
252.50 |
235.85 - 304.00 |
1.1789 times |
Fri 29 November 2024 |
251.15 (-10.14%) |
280.00 |
228.10 - 335.00 |
1.043 times |
Thu 31 October 2024 |
279.50 (-8.9%) |
306.80 |
254.10 - 339.15 |
0.7286 times |
DMA SMA EMA moving averages of Walchandnagar Industries WALCHANNAG
DMA (daily moving average) of Walchandnagar Industries WALCHANNAG
| DMA period | DMA value | | 5 day DMA | 170.07 | | 12 day DMA | 173.7 | | 20 day DMA | 181.63 | | 35 day DMA | 193.37 | | 50 day DMA | 206.59 | | 100 day DMA | 193.41 | | 150 day DMA | 205.17 | | 200 day DMA | 222.53 | EMA (exponential moving average) of Walchandnagar Industries WALCHANNAG
| EMA period | EMA current | EMA prev | EMA prev2 | | 5 day EMA | 169.7 | 170.79 | 171.66 | | 12 day EMA | 174.75 | 176.06 | 177.34 | | 20 day EMA | 181.04 | 182.46 | 183.87 | | 35 day EMA | 192.21 | 193.66 | 195.11 | | 50 day EMA | 203.41 | 204.87 | 206.33 |
SMA (simple moving average) of Walchandnagar Industries WALCHANNAG
| SMA period | SMA current | SMA prev | SMA prev2 | | 5 day SMA | 170.07 | 170.73 | 169.75 | | 12 day SMA | 173.7 | 176.1 | 178.56 | | 20 day SMA | 181.63 | 182.7 | 184.06 | | 35 day SMA | 193.37 | 195.49 | 198.04 | | 50 day SMA | 206.59 | 207.29 | 208.11 | | 100 day SMA | 193.41 | 193.35 | 193.28 | | 150 day SMA | 205.17 | 205.78 | 206.37 | | 200 day SMA | 222.53 | 223.34 | 224.09 |
|
|
