VaTech WABAG full analysis,charts,indicators,moving averages,SMA,DMA,EMA,ADX,MACD,RSIVa Tech WABAG WideScreen charts, DMA,SMA,EMA technical analysis, forecast prediction, by indicators ADX,MACD,RSI,CCI NSE stock exchange
operates under Utilities:Non-Elec. sector
Daily price and charts and targets VaTech Strong Daily Stock price targets for VaTech WABAG are 1407.05 and 1433.55 | Daily Target 1 | 1386.2 | | Daily Target 2 | 1401.4 | | Daily Target 3 | 1412.7 | | Daily Target 4 | 1427.9 | | Daily Target 5 | 1439.2 |
Daily price and volume Va Tech
| Date |
Closing |
Open |
Range |
Volume |
Wed 29 October 2025 |
1416.60 (0.94%) |
1407.00 |
1397.50 - 1424.00 |
0.806 times |
Tue 28 October 2025 |
1403.40 (0.13%) |
1401.50 |
1397.10 - 1413.00 |
0.6514 times |
Mon 27 October 2025 |
1401.60 (-0.62%) |
1422.50 |
1398.00 - 1422.90 |
0.6161 times |
Fri 24 October 2025 |
1410.30 (0.1%) |
1414.00 |
1399.00 - 1420.00 |
0.7662 times |
Thu 23 October 2025 |
1408.90 (-1.83%) |
1435.00 |
1404.00 - 1435.00 |
1.134 times |
Tue 21 October 2025 |
1435.20 (1.83%) |
1403.00 |
1403.00 - 1444.00 |
0.5286 times |
Mon 20 October 2025 |
1409.40 (-0.54%) |
1421.00 |
1393.80 - 1427.30 |
1.6191 times |
Fri 17 October 2025 |
1417.00 (-0.87%) |
1428.10 |
1390.30 - 1428.10 |
2.738 times |
Thu 16 October 2025 |
1429.40 (0.66%) |
1429.00 |
1414.20 - 1434.80 |
0.5056 times |
Wed 15 October 2025 |
1420.00 (1.46%) |
1400.50 |
1396.00 - 1423.00 |
0.6349 times |
Tue 14 October 2025 |
1399.50 (-0.09%) |
1404.00 |
1395.60 - 1425.00 |
1.0647 times |
Weekly price and charts VaTech Strong weekly Stock price targets for VaTech WABAG are 1393.4 and 1420.3 | Weekly Target 1 | 1385.67 | | Weekly Target 2 | 1401.13 | | Weekly Target 3 | 1412.5666666667 | | Weekly Target 4 | 1428.03 | | Weekly Target 5 | 1439.47 |
Weekly price and volumes for Va Tech
| Date |
Closing |
Open |
Range |
Volume |
Wed 29 October 2025 |
1416.60 (0.45%) |
1422.50 |
1397.10 - 1424.00 |
0.4254 times |
Fri 24 October 2025 |
1410.30 (-0.47%) |
1421.00 |
1393.80 - 1444.00 |
0.8304 times |
Fri 17 October 2025 |
1417.00 (-0.55%) |
1421.90 |
1390.30 - 1437.60 |
1.2391 times |
Fri 10 October 2025 |
1424.80 (1.3%) |
1411.10 |
1392.90 - 1444.40 |
1.243 times |
Fri 03 October 2025 |
1406.50 (-3.11%) |
1438.00 |
1403.00 - 1459.80 |
1.0334 times |
Fri 26 September 2025 |
1451.60 (-7.36%) |
1562.00 |
1431.90 - 1580.00 |
0.9956 times |
Fri 19 September 2025 |
1567.00 (2.49%) |
1528.90 |
1520.00 - 1578.00 |
1.1396 times |
Fri 12 September 2025 |
1528.90 (1.47%) |
1516.50 |
1501.10 - 1553.80 |
0.7391 times |
Fri 05 September 2025 |
1506.80 (3.36%) |
1464.80 |
1462.00 - 1543.70 |
1.1474 times |
Fri 29 August 2025 |
1457.80 (-8.41%) |
1594.20 |
1453.10 - 1600.90 |
1.207 times |
Fri 22 August 2025 |
1591.60 (0.47%) |
1609.90 |
1558.70 - 1647.50 |
1.6556 times |

Monthly price and charts VaTech Strong monthly Stock price targets for VaTech WABAG are 1376.1 and 1430.8 | Monthly Target 1 | 1362.6 | | Monthly Target 2 | 1389.6 | | Monthly Target 3 | 1417.3 | | Monthly Target 4 | 1444.3 | | Monthly Target 5 | 1472 |
Monthly price and volumes Va Tech
| Date |
Closing |
Open |
Range |
Volume |
Wed 29 October 2025 |
1416.60 (-1.28%) |
1444.90 |
1390.30 - 1445.00 |
0.4341 times |
Tue 30 September 2025 |
1435.00 (-1.56%) |
1464.80 |
1412.20 - 1580.00 |
0.4769 times |
Fri 29 August 2025 |
1457.80 (-8.07%) |
1576.00 |
1453.10 - 1647.50 |
0.6004 times |
Thu 31 July 2025 |
1585.70 (7.04%) |
1484.20 |
1398.80 - 1672.10 |
1.1968 times |
Mon 30 June 2025 |
1481.40 (-9.03%) |
1624.80 |
1460.00 - 1658.70 |
0.7372 times |
Fri 30 May 2025 |
1628.50 (26.72%) |
1290.00 |
1250.00 - 1680.00 |
1.4125 times |
Wed 30 April 2025 |
1285.10 (-11.66%) |
1440.00 |
1140.05 - 1477.70 |
0.8061 times |
Fri 28 March 2025 |
1454.65 (11.6%) |
1315.95 |
1218.00 - 1615.00 |
1.1668 times |
Fri 28 February 2025 |
1303.50 (-5.02%) |
1334.25 |
1244.75 - 1550.00 |
1.8621 times |
Fri 31 January 2025 |
1372.35 (-16.48%) |
1660.00 |
1114.00 - 1690.00 |
1.3069 times |
Tue 31 December 2024 |
1643.10 (-8.46%) |
1808.40 |
1523.75 - 1944.00 |
2.4516 times |

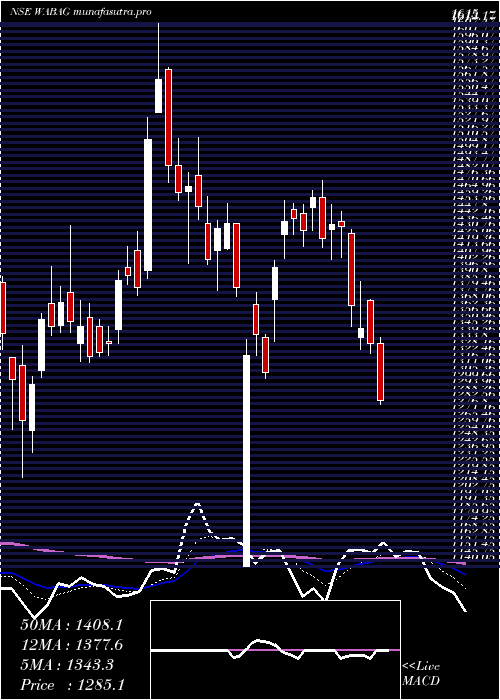
DMA SMA EMA moving averages of Va Tech WABAG
DMA (daily moving average) of Va Tech WABAG
| DMA period | DMA value | | 5 day DMA | 1408.16 | | 12 day DMA | 1412.67 | | 20 day DMA | 1415.12 | | 35 day DMA | 1460.73 | | 50 day DMA | 1484.3 | | 100 day DMA | 1504.44 | | 150 day DMA | 1483.22 | | 200 day DMA | 1459.13 | EMA (exponential moving average) of Va Tech WABAG
| EMA period | EMA current | EMA prev | EMA prev2 | | 5 day EMA | 1411.01 | 1408.22 | 1410.63 | | 12 day EMA | 1415.91 | 1415.79 | 1418.04 | | 20 day EMA | 1427.49 | 1428.64 | 1431.3 | | 35 day EMA | 1451.58 | 1453.64 | 1456.6 | | 50 day EMA | 1481.13 | 1483.76 | 1487.04 |
SMA (simple moving average) of Va Tech WABAG
| SMA period | SMA current | SMA prev | SMA prev2 | | 5 day SMA | 1408.16 | 1411.88 | 1413.08 | | 12 day SMA | 1412.67 | 1413.35 | 1415.91 | | 20 day SMA | 1415.12 | 1415.2 | 1417.61 | | 35 day SMA | 1460.73 | 1463.38 | 1466.33 | | 50 day SMA | 1484.3 | 1487.65 | 1490.05 | | 100 day SMA | 1504.44 | 1506.38 | 1508.56 | | 150 day SMA | 1483.22 | 1483.01 | 1482.95 | | 200 day SMA | 1459.13 | 1460.08 | 1460.86 |
|
|
