WaareeEnergies WAAREEENER full analysis,charts,indicators,moving averages,SMA,DMA,EMA,ADX,MACD,RSIWaaree Energies WAAREEENER WideScreen charts, DMA,SMA,EMA technical analysis, forecast prediction, by indicators ADX,MACD,RSI,CCI NSE stock exchange
Daily price and charts and targets WaareeEnergies Strong Daily Stock price targets for WaareeEnergies WAAREEENER are 3428.2 and 3538.2 | Daily Target 1 | 3408.8 | | Daily Target 2 | 3447.6 | | Daily Target 3 | 3518.8 | | Daily Target 4 | 3557.6 | | Daily Target 5 | 3628.8 |
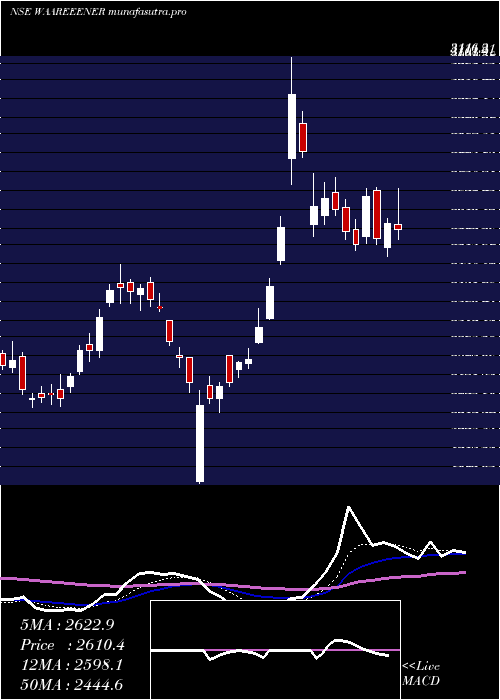
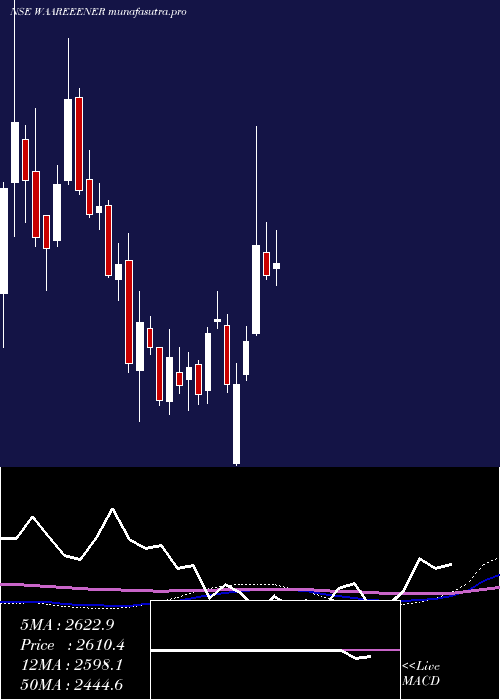
Daily price and volume Waaree Energies
| Date |
Closing |
Open |
Range |
Volume |
Tue 28 October 2025 |
3486.40 (-2.76%) |
3589.80 |
3480.00 - 3590.00 |
0.5676 times |
Mon 27 October 2025 |
3585.50 (1.59%) |
3550.00 |
3537.00 - 3643.00 |
1.104 times |
Fri 24 October 2025 |
3529.50 (-1.07%) |
3569.00 |
3510.10 - 3610.00 |
0.4303 times |
Thu 23 October 2025 |
3567.50 (1.51%) |
3545.00 |
3522.00 - 3623.00 |
0.8964 times |
Tue 21 October 2025 |
3514.30 (0.22%) |
3516.00 |
3505.00 - 3531.00 |
0.1009 times |
Mon 20 October 2025 |
3506.60 (-0.81%) |
3575.00 |
3490.00 - 3583.40 |
0.4583 times |
Fri 17 October 2025 |
3535.30 (-2.54%) |
3650.00 |
3520.10 - 3718.80 |
2.4571 times |
Thu 16 October 2025 |
3627.40 (3.1%) |
3587.00 |
3526.00 - 3639.00 |
1.364 times |
Wed 15 October 2025 |
3518.40 (0.97%) |
3510.00 |
3455.50 - 3609.00 |
1.4791 times |
Tue 14 October 2025 |
3484.50 (2.35%) |
3475.60 |
3470.00 - 3572.80 |
1.1422 times |
Mon 13 October 2025 |
3404.60 (2.14%) |
3339.90 |
3335.10 - 3426.30 |
0.8649 times |
Weekly price and charts WaareeEnergies Strong weekly Stock price targets for WaareeEnergies WAAREEENER are 3401.7 and 3564.7 | Weekly Target 1 | 3373.47 | | Weekly Target 2 | 3429.93 | | Weekly Target 3 | 3536.4666666667 | | Weekly Target 4 | 3592.93 | | Weekly Target 5 | 3699.47 |
Weekly price and volumes for Waaree Energies
| Date |
Closing |
Open |
Range |
Volume |
Tue 28 October 2025 |
3486.40 (-1.22%) |
3550.00 |
3480.00 - 3643.00 |
0.3041 times |
Fri 24 October 2025 |
3529.50 (-0.16%) |
3575.00 |
3490.00 - 3623.00 |
0.3431 times |
Fri 17 October 2025 |
3535.30 (6.06%) |
3339.90 |
3335.10 - 3718.80 |
1.3292 times |
Fri 10 October 2025 |
3333.40 (-3.07%) |
3440.00 |
3270.00 - 3464.00 |
0.2938 times |
Fri 03 October 2025 |
3438.90 (7.21%) |
3225.00 |
3142.70 - 3469.00 |
0.598 times |
Fri 26 September 2025 |
3207.60 (-9.04%) |
3400.40 |
3182.00 - 3579.00 |
0.835 times |
Fri 19 September 2025 |
3526.30 (-2.97%) |
3640.00 |
3470.20 - 3728.00 |
0.9061 times |
Fri 12 September 2025 |
3634.20 (12.88%) |
3228.00 |
3151.20 - 3865.00 |
2.2739 times |
Fri 05 September 2025 |
3219.50 (-5.36%) |
3447.90 |
3162.00 - 3447.90 |
0.7705 times |
Fri 29 August 2025 |
3402.00 (6.69%) |
3190.00 |
3083.00 - 3496.80 |
2.3463 times |
Fri 22 August 2025 |
3188.60 (10.61%) |
2949.00 |
2936.00 - 3299.00 |
0.9224 times |
Monthly price and charts WaareeEnergies Strong monthly Stock price targets for WaareeEnergies WAAREEENER are 3378.2 and 3827 | Monthly Target 1 | 3042.93 | | Monthly Target 2 | 3264.67 | | Monthly Target 3 | 3491.7333333333 | | Monthly Target 4 | 3713.47 | | Monthly Target 5 | 3940.53 |
Monthly price and volumes Waaree Energies
| Date |
Closing |
Open |
Range |
Volume |
Tue 28 October 2025 |
3486.40 (4.75%) |
3344.00 |
3270.00 - 3718.80 |
0.6494 times |
Tue 30 September 2025 |
3328.40 (-2.16%) |
3447.90 |
3142.70 - 3865.00 |
1.3323 times |
Fri 29 August 2025 |
3402.00 (13.69%) |
3024.90 |
2830.50 - 3496.80 |
1.3716 times |
Thu 31 July 2025 |
2992.40 (-4.68%) |
3178.00 |
2905.00 - 3342.00 |
1.2645 times |
Mon 30 June 2025 |
3139.40 (5.39%) |
2984.90 |
2641.00 - 3154.00 |
1.1712 times |
Fri 30 May 2025 |
2978.90 (14.38%) |
2609.90 |
2530.30 - 3080.00 |
1.0604 times |
Wed 30 April 2025 |
2604.50 (8.31%) |
2380.00 |
1863.00 - 3116.30 |
1.3365 times |
Fri 28 March 2025 |
2404.65 (11.4%) |
2179.00 |
2066.40 - 2508.00 |
0.3627 times |
Fri 28 February 2025 |
2158.55 (-9.79%) |
2369.45 |
2052.40 - 2414.00 |
0.449 times |
Fri 31 January 2025 |
2392.70 (-16.18%) |
2869.00 |
2026.00 - 2906.00 |
1.0024 times |
Tue 31 December 2024 |
2854.60 (7%) |
2695.00 |
2675.05 - 3445.45 |
1.2211 times |

DMA SMA EMA moving averages of Waaree Energies WAAREEENER
DMA (daily moving average) of Waaree Energies WAAREEENER
| DMA period | DMA value | | 5 day DMA | 3536.64 | | 12 day DMA | 3507.78 | | 20 day DMA | 3449.3 | | 35 day DMA | 3459.92 | | 50 day DMA | 3376.91 | | 100 day DMA | 3201.23 | | 150 day DMA | 3000.76 | | 200 day DMA | 2828.36 | EMA (exponential moving average) of Waaree Energies WAAREEENER
| EMA period | EMA current | EMA prev | EMA prev2 | | 5 day EMA | 3528.11 | 3548.96 | 3530.7 | | 12 day EMA | 3505.6 | 3509.09 | 3495.2 | | 20 day EMA | 3476.95 | 3475.96 | 3464.43 | | 35 day EMA | 3416.15 | 3412.01 | 3401.8 | | 50 day EMA | 3367.8 | 3362.96 | 3353.88 |
SMA (simple moving average) of Waaree Energies WAAREEENER
| SMA period | SMA current | SMA prev | SMA prev2 | | 5 day SMA | 3536.64 | 3540.68 | 3530.64 | | 12 day SMA | 3507.78 | 3495.98 | 3474.13 | | 20 day SMA | 3449.3 | 3435.36 | 3428.34 | | 35 day SMA | 3459.92 | 3452.29 | 3441.31 | | 50 day SMA | 3376.91 | 3366.02 | 3356.01 | | 100 day SMA | 3201.23 | 3195.17 | 3188.19 | | 150 day SMA | 3000.76 | 2992.55 | 2983.17 | | 200 day SMA | 2828.36 | 2824.64 | 2820.81 |
|
|
