VstIndustries VSTIND full analysis,charts,indicators,moving averages,SMA,DMA,EMA,ADX,MACD,RSIVst Industries VSTIND WideScreen charts, DMA,SMA,EMA technical analysis, forecast prediction, by indicators ADX,MACD,RSI,CCI NSE stock exchange
operates under Cigarettes-Tobacco Products sector
Daily price and charts and targets VstIndustries Strong Daily Stock price targets for VstIndustries VSTIND are 257.85 and 260.35 | Daily Target 1 | 255.95 | | Daily Target 2 | 257.25 | | Daily Target 3 | 258.45 | | Daily Target 4 | 259.75 | | Daily Target 5 | 260.95 |
Daily price and volume Vst Industries
| Date |
Closing |
Open |
Range |
Volume |
Wed 29 October 2025 |
258.55 (0.9%) |
258.00 |
257.15 - 259.65 |
1.0324 times |
Tue 28 October 2025 |
256.25 (-0.21%) |
257.00 |
255.00 - 259.50 |
0.9326 times |
Mon 27 October 2025 |
256.80 (-0.19%) |
258.00 |
256.10 - 259.15 |
0.5958 times |
Fri 24 October 2025 |
257.30 (-0.21%) |
258.00 |
256.10 - 258.25 |
0.7106 times |
Thu 23 October 2025 |
257.85 (-0.44%) |
259.00 |
257.50 - 261.60 |
1.2312 times |
Tue 21 October 2025 |
259.00 (2.35%) |
253.40 |
253.40 - 260.55 |
0.5483 times |
Mon 20 October 2025 |
253.05 (-0.22%) |
253.50 |
250.60 - 254.85 |
1.1476 times |
Fri 17 October 2025 |
253.60 (-0.43%) |
254.60 |
253.00 - 255.90 |
0.7177 times |
Thu 16 October 2025 |
254.70 (1.17%) |
251.75 |
251.45 - 255.50 |
0.6981 times |
Wed 15 October 2025 |
251.75 (-1.78%) |
256.20 |
250.00 - 256.95 |
2.3856 times |
Tue 14 October 2025 |
256.30 (-0.23%) |
257.00 |
256.00 - 258.00 |
0.6229 times |
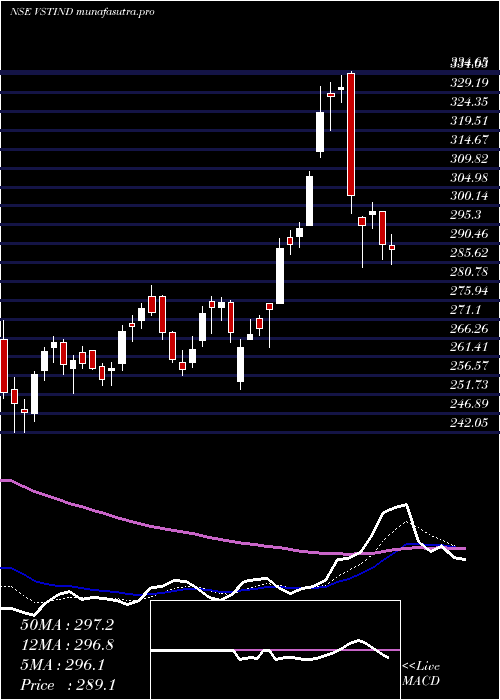
Weekly price and charts VstIndustries Strong weekly Stock price targets for VstIndustries VSTIND are 256.78 and 261.43 | Weekly Target 1 | 253.08 | | Weekly Target 2 | 255.82 | | Weekly Target 3 | 257.73333333333 | | Weekly Target 4 | 260.47 | | Weekly Target 5 | 262.38 |
Weekly price and volumes for Vst Industries
| Date |
Closing |
Open |
Range |
Volume |
Wed 29 October 2025 |
258.55 (0.49%) |
258.00 |
255.00 - 259.65 |
0.5383 times |
Fri 24 October 2025 |
257.30 (1.46%) |
253.50 |
250.60 - 261.60 |
0.7646 times |
Fri 17 October 2025 |
253.60 (-1.99%) |
258.40 |
250.00 - 259.75 |
1.0649 times |
Fri 10 October 2025 |
258.75 (-1.33%) |
262.25 |
258.00 - 265.15 |
1.0209 times |
Fri 03 October 2025 |
262.25 (0.48%) |
262.55 |
256.00 - 264.70 |
0.7764 times |
Fri 26 September 2025 |
261.00 (-2.97%) |
269.00 |
259.50 - 270.00 |
0.9188 times |
Fri 19 September 2025 |
269.00 (0.69%) |
267.95 |
267.30 - 274.10 |
1.1709 times |
Fri 12 September 2025 |
267.15 (-0.54%) |
269.85 |
266.30 - 271.00 |
1.0099 times |
Fri 05 September 2025 |
268.60 (-0.09%) |
268.90 |
266.10 - 275.00 |
1.8534 times |
Fri 29 August 2025 |
268.85 (-2.64%) |
276.00 |
268.20 - 278.20 |
0.8819 times |
Fri 22 August 2025 |
276.15 (1.3%) |
274.00 |
270.00 - 285.05 |
1.8958 times |
Monthly price and charts VstIndustries Strong monthly Stock price targets for VstIndustries VSTIND are 246.7 and 261.85 | Monthly Target 1 | 242.75 | | Monthly Target 2 | 250.65 | | Monthly Target 3 | 257.9 | | Monthly Target 4 | 265.8 | | Monthly Target 5 | 273.05 |
Monthly price and volumes Vst Industries
| Date |
Closing |
Open |
Range |
Volume |
Wed 29 October 2025 |
258.55 (0.04%) |
260.30 |
250.00 - 265.15 |
0.3035 times |
Tue 30 September 2025 |
258.45 (-3.87%) |
268.90 |
256.00 - 275.00 |
0.4328 times |
Fri 29 August 2025 |
268.85 (-4.8%) |
282.20 |
268.20 - 285.05 |
0.4797 times |
Thu 31 July 2025 |
282.40 (-8.16%) |
317.70 |
277.50 - 319.10 |
2.0188 times |
Mon 30 June 2025 |
307.50 (7.57%) |
286.00 |
277.50 - 308.80 |
1.1048 times |
Fri 30 May 2025 |
285.85 (-1.55%) |
290.00 |
272.55 - 300.90 |
0.7606 times |
Wed 30 April 2025 |
290.35 (10.29%) |
265.75 |
253.00 - 334.65 |
1.6777 times |
Fri 28 March 2025 |
263.25 (4.32%) |
253.15 |
242.05 - 279.70 |
1.3683 times |
Fri 28 February 2025 |
252.35 (-21.24%) |
323.00 |
250.75 - 338.90 |
1.2659 times |
Fri 31 January 2025 |
320.40 (-4.7%) |
336.20 |
304.70 - 346.90 |
0.5879 times |
Tue 31 December 2024 |
336.20 (3.94%) |
323.45 |
318.00 - 373.00 |
0.9004 times |

DMA SMA EMA moving averages of Vst Industries VSTIND
DMA (daily moving average) of Vst Industries VSTIND
| DMA period | DMA value | | 5 day DMA | 257.35 | | 12 day DMA | 256 | | 20 day DMA | 257.66 | | 35 day DMA | 261.6 | | 50 day DMA | 264.79 | | 100 day DMA | 276.12 | | 150 day DMA | 279.13 | | 200 day DMA | 283.28 | EMA (exponential moving average) of Vst Industries VSTIND
| EMA period | EMA current | EMA prev | EMA prev2 | | 5 day EMA | 257.25 | 256.6 | 256.78 | | 12 day EMA | 257.26 | 257.02 | 257.16 | | 20 day EMA | 258.46 | 258.45 | 258.68 | | 35 day EMA | 261.51 | 261.68 | 262 | | 50 day EMA | 265.03 | 265.29 | 265.66 |
SMA (simple moving average) of Vst Industries VSTIND
| SMA period | SMA current | SMA prev | SMA prev2 | | 5 day SMA | 257.35 | 257.44 | 256.8 | | 12 day SMA | 256 | 256.02 | 256.28 | | 20 day SMA | 257.66 | 257.62 | 257.86 | | 35 day SMA | 261.6 | 261.87 | 262.23 | | 50 day SMA | 264.79 | 265.07 | 265.44 | | 100 day SMA | 276.12 | 276.33 | 276.55 | | 150 day SMA | 279.13 | 279.2 | 279.28 | | 200 day SMA | 283.28 | 283.64 | 284 |
|
|
