VishalMega VMM full analysis,charts,indicators,moving averages,SMA,DMA,EMA,ADX,MACD,RSIVishal Mega VMM WideScreen charts, DMA,SMA,EMA technical analysis, forecast prediction, by indicators ADX,MACD,RSI,CCI NSE stock exchange
Daily price and charts and targets VishalMega Strong Daily Stock price targets for VishalMega VMM are 145.21 and 147.67 | Daily Target 1 | 144.62 | | Daily Target 2 | 145.79 | | Daily Target 3 | 147.07666666667 | | Daily Target 4 | 148.25 | | Daily Target 5 | 149.54 |
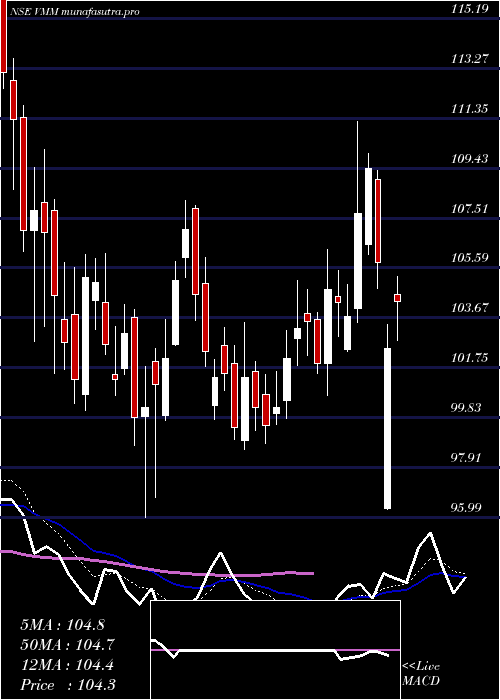
Daily price and volume Vishal Mega
| Date |
Closing |
Open |
Range |
Volume |
Tue 28 October 2025 |
146.97 (-0.63%) |
147.55 |
145.90 - 148.36 |
1.1533 times |
Mon 27 October 2025 |
147.90 (-0.26%) |
148.00 |
147.20 - 149.82 |
0.9463 times |
Fri 24 October 2025 |
148.29 (1.27%) |
146.60 |
146.15 - 148.70 |
0.8217 times |
Thu 23 October 2025 |
146.43 (-1.11%) |
148.20 |
145.45 - 149.24 |
1.1948 times |
Tue 21 October 2025 |
148.08 (0.02%) |
148.09 |
147.50 - 149.43 |
0.1238 times |
Mon 20 October 2025 |
148.05 (-0.26%) |
148.45 |
147.47 - 149.10 |
0.6286 times |
Fri 17 October 2025 |
148.43 (-0.02%) |
147.20 |
146.39 - 149.10 |
1.2178 times |
Thu 16 October 2025 |
148.46 (2.65%) |
145.79 |
145.79 - 149.11 |
1.3865 times |
Wed 15 October 2025 |
144.63 (-0.74%) |
145.82 |
143.60 - 146.41 |
1.094 times |
Tue 14 October 2025 |
145.71 (-1.33%) |
147.65 |
145.31 - 147.96 |
1.4331 times |
Mon 13 October 2025 |
147.67 (1.01%) |
146.25 |
146.15 - 148.35 |
1.5223 times |
Weekly price and charts VishalMega Strong weekly Stock price targets for VishalMega VMM are 144.48 and 148.4 | Weekly Target 1 | 143.64 | | Weekly Target 2 | 145.31 | | Weekly Target 3 | 147.56333333333 | | Weekly Target 4 | 149.23 | | Weekly Target 5 | 151.48 |
Weekly price and volumes for Vishal Mega
| Date |
Closing |
Open |
Range |
Volume |
Tue 28 October 2025 |
146.97 (-0.89%) |
148.00 |
145.90 - 149.82 |
0.1491 times |
Fri 24 October 2025 |
148.29 (-0.09%) |
148.45 |
145.45 - 149.43 |
0.1966 times |
Fri 17 October 2025 |
148.43 (1.53%) |
146.25 |
143.60 - 149.11 |
0.4724 times |
Fri 10 October 2025 |
146.20 (-2.53%) |
149.99 |
144.10 - 152.18 |
0.4399 times |
Fri 03 October 2025 |
149.99 (4.2%) |
144.65 |
140.80 - 150.69 |
0.5372 times |
Fri 26 September 2025 |
143.95 (-5.51%) |
151.35 |
142.00 - 151.44 |
0.4597 times |
Fri 19 September 2025 |
152.35 (-0.16%) |
152.51 |
146.03 - 153.40 |
0.8382 times |
Fri 12 September 2025 |
152.59 (0.07%) |
153.20 |
150.13 - 154.93 |
0.6321 times |
Fri 05 September 2025 |
152.48 (2.05%) |
150.00 |
144.84 - 155.32 |
1.3396 times |
Fri 29 August 2025 |
149.41 (-0.84%) |
151.15 |
146.51 - 157.60 |
4.9353 times |
Fri 22 August 2025 |
150.67 (2.8%) |
149.80 |
145.40 - 152.30 |
1.7468 times |

Monthly price and charts VishalMega Strong monthly Stock price targets for VishalMega VMM are 141 and 149.58 | Monthly Target 1 | 139 | | Monthly Target 2 | 142.99 | | Monthly Target 3 | 147.58333333333 | | Monthly Target 4 | 151.57 | | Monthly Target 5 | 156.16 |
Monthly price and volumes Vishal Mega
| Date |
Closing |
Open |
Range |
Volume |
Tue 28 October 2025 |
146.97 (-1.37%) |
149.00 |
143.60 - 152.18 |
0.2032 times |
Tue 30 September 2025 |
149.01 (-0.27%) |
150.00 |
140.80 - 155.32 |
0.5092 times |
Fri 29 August 2025 |
149.41 (7.07%) |
139.90 |
138.00 - 157.60 |
1.3765 times |
Thu 31 July 2025 |
139.54 (4.15%) |
134.14 |
126.35 - 143.42 |
0.691 times |
Mon 30 June 2025 |
133.98 (7.48%) |
124.39 |
113.50 - 137.80 |
3.4004 times |
Fri 30 May 2025 |
124.66 (5.22%) |
115.95 |
115.26 - 133.00 |
0.8235 times |
Wed 30 April 2025 |
118.48 (13.66%) |
102.45 |
96.30 - 118.48 |
0.5069 times |
Fri 28 March 2025 |
104.24 (4.02%) |
102.00 |
96.75 - 108.20 |
0.5948 times |
Fri 28 February 2025 |
100.21 (-7.17%) |
113.00 |
95.99 - 126.87 |
0.806 times |
Fri 31 January 2025 |
107.95 (1.43%) |
106.00 |
97.27 - 117.34 |
1.0886 times |
Tue 31 December 2024 |
106.43 (0%) |
104.00 |
96.70 - 114.75 |
2.3254 times |

DMA SMA EMA moving averages of Vishal Mega VMM
DMA (daily moving average) of Vishal Mega VMM
| DMA period | DMA value | | 5 day DMA | 147.53 | | 12 day DMA | 147.24 | | 20 day DMA | 148.01 | | 35 day DMA | 148.69 | | 50 day DMA | 148.88 | | 100 day DMA | 141.62 | | 150 day DMA | 132.79 | | 200 day DMA | 126.13 | EMA (exponential moving average) of Vishal Mega VMM
| EMA period | EMA current | EMA prev | EMA prev2 | | 5 day EMA | 147.49 | 147.75 | 147.67 | | 12 day EMA | 147.63 | 147.75 | 147.72 | | 20 day EMA | 147.81 | 147.9 | 147.9 | | 35 day EMA | 148 | 148.06 | 148.07 | | 50 day EMA | 148.18 | 148.23 | 148.24 |
SMA (simple moving average) of Vishal Mega VMM
| SMA period | SMA current | SMA prev | SMA prev2 | | 5 day SMA | 147.53 | 147.75 | 147.86 | | 12 day SMA | 147.24 | 147.34 | 147.52 | | 20 day SMA | 148.01 | 147.85 | 147.76 | | 35 day SMA | 148.69 | 148.85 | 148.95 | | 50 day SMA | 148.88 | 148.82 | 148.67 | | 100 day SMA | 141.62 | 141.41 | 141.2 | | 150 day SMA | 132.79 | 132.47 | 132.15 | | 200 day SMA | 126.13 | 125.92 | 125.74 |
|
|
