VMarc VMARCIND_SM full analysis,charts,indicators,moving averages,SMA,DMA,EMA,ADX,MACD,RSIV Marc VMARCIND_SM WideScreen charts, DMA,SMA,EMA technical analysis, forecast prediction, by indicators ADX,MACD,RSI,CCI NSE stock exchange
Daily price and charts and targets VMarc Strong Daily Stock price targets for VMarc VMARCIND_SM are 544.8 and 578.7 | Daily Target 1 | 535.6 | | Daily Target 2 | 554 | | Daily Target 3 | 569.5 | | Daily Target 4 | 587.9 | | Daily Target 5 | 603.4 |
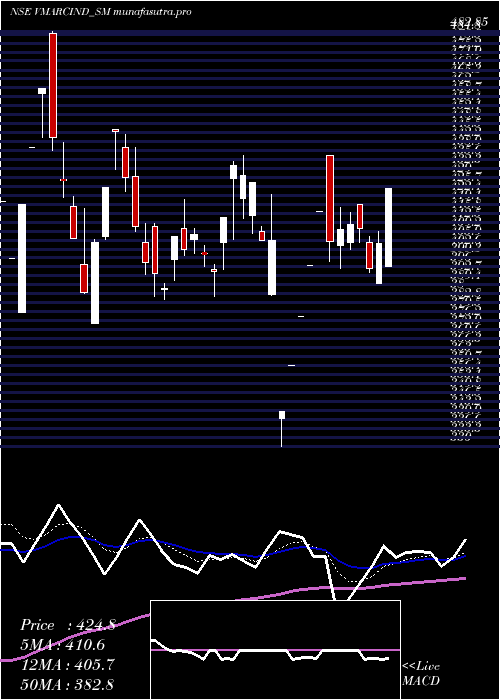
Daily price and volume V Marc
| Date |
Closing |
Open |
Range |
Volume |
Tue 28 October 2025 |
572.40 (-2.39%) |
585.00 |
551.10 - 585.00 |
1.3239 times |
Mon 27 October 2025 |
586.40 (2.43%) |
575.00 |
575.00 - 613.00 |
0.8451 times |
Fri 24 October 2025 |
572.50 (0.41%) |
570.15 |
551.15 - 577.00 |
0.6127 times |
Thu 23 October 2025 |
570.15 (-6.49%) |
615.00 |
550.55 - 615.00 |
1.4718 times |
Tue 21 October 2025 |
609.70 (0.42%) |
618.00 |
605.00 - 620.00 |
0.1549 times |
Mon 20 October 2025 |
607.15 (-0.86%) |
629.90 |
600.05 - 630.00 |
0.838 times |
Fri 17 October 2025 |
612.40 (4.92%) |
579.00 |
579.00 - 615.00 |
2.0282 times |
Thu 16 October 2025 |
583.70 (3.62%) |
580.00 |
555.05 - 592.00 |
0.5423 times |
Wed 15 October 2025 |
563.30 (1.44%) |
572.00 |
538.05 - 577.00 |
0.9789 times |
Tue 14 October 2025 |
555.30 (-5.48%) |
599.40 |
550.00 - 608.50 |
1.2042 times |
Mon 13 October 2025 |
587.50 (7.62%) |
546.00 |
546.00 - 593.65 |
3.507 times |
Weekly price and charts VMarc Strong weekly Stock price targets for VMarc VMARCIND_SM are 530.8 and 592.7 | Weekly Target 1 | 516.93 | | Weekly Target 2 | 544.67 | | Weekly Target 3 | 578.83333333333 | | Weekly Target 4 | 606.57 | | Weekly Target 5 | 640.73 |
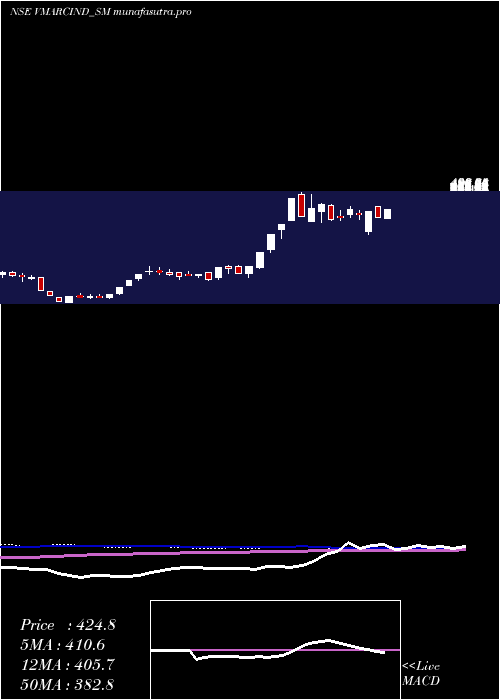
Weekly price and volumes for V Marc
| Date |
Closing |
Open |
Range |
Volume |
Tue 28 October 2025 |
572.40 (-0.02%) |
575.00 |
551.10 - 613.00 |
0.6293 times |
Fri 24 October 2025 |
572.50 (-6.52%) |
629.90 |
550.55 - 630.00 |
0.8929 times |
Fri 17 October 2025 |
612.40 (12.18%) |
546.00 |
538.05 - 615.00 |
2.3968 times |
Fri 10 October 2025 |
545.90 (25.7%) |
439.00 |
420.00 - 549.90 |
2.0964 times |
Fri 03 October 2025 |
434.30 (-0.16%) |
439.00 |
423.00 - 453.00 |
0.3923 times |
Fri 26 September 2025 |
435.00 (-1.69%) |
456.00 |
420.00 - 456.00 |
0.2125 times |
Fri 19 September 2025 |
442.50 (-1.07%) |
450.00 |
430.10 - 465.00 |
0.2922 times |
Fri 12 September 2025 |
447.30 (-3.82%) |
460.00 |
423.05 - 469.00 |
1.1279 times |
Fri 05 September 2025 |
465.05 (-1.04%) |
475.00 |
451.85 - 498.85 |
1.3813 times |
Fri 29 August 2025 |
469.95 (-1.22%) |
475.75 |
448.25 - 496.00 |
0.5783 times |
Fri 22 August 2025 |
475.75 (-1.82%) |
495.00 |
460.25 - 513.00 |
1.228 times |
Monthly price and charts VMarc Strong monthly Stock price targets for VMarc VMARCIND_SM are 496.2 and 706.2 | Monthly Target 1 | 330.8 | | Monthly Target 2 | 451.6 | | Monthly Target 3 | 540.8 | | Monthly Target 4 | 661.6 | | Monthly Target 5 | 750.8 |
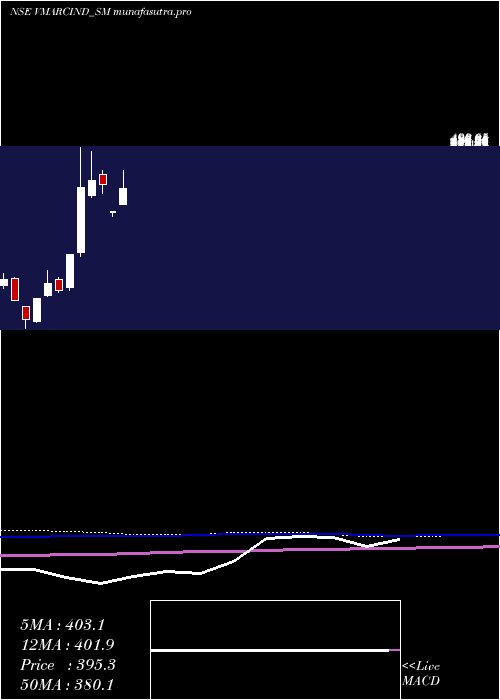
Monthly price and volumes V Marc
| Date |
Closing |
Open |
Range |
Volume |
Tue 28 October 2025 |
572.40 (34.05%) |
423.00 |
420.00 - 630.00 |
0.656 times |
Tue 30 September 2025 |
427.00 (-9.14%) |
475.00 |
420.00 - 498.85 |
0.3426 times |
Fri 29 August 2025 |
469.95 (2.69%) |
448.05 |
418.10 - 513.00 |
0.415 times |
Thu 31 July 2025 |
457.65 (33.58%) |
359.70 |
359.70 - 474.00 |
0.9036 times |
Mon 30 June 2025 |
342.60 (-15.59%) |
340.00 |
330.00 - 342.60 |
0.0269 times |
Tue 08 October 2024 |
405.90 (-1.99%) |
428.65 |
385.40 - 437.00 |
0.1248 times |
Mon 30 September 2024 |
414.15 (3.78%) |
379.10 |
375.00 - 482.85 |
1.1678 times |
Fri 30 August 2024 |
399.05 (64.96%) |
247.00 |
238.35 - 490.65 |
2.5254 times |
Wed 31 July 2024 |
241.90 (52.09%) |
166.00 |
159.20 - 241.90 |
2.7134 times |
Fri 28 June 2024 |
159.05 (-9.78%) |
185.00 |
154.35 - 188.95 |
1.1245 times |
Fri 31 May 2024 |
176.30 (26.33%) |
146.50 |
144.00 - 205.45 |
2.6389 times |
DMA SMA EMA moving averages of V Marc VMARCIND_SM
DMA (daily moving average) of V Marc VMARCIND_SM
| DMA period | DMA value | | 5 day DMA | 582.23 | | 12 day DMA | 580.53 | | 20 day DMA | 527.39 | | 35 day DMA | 491.39 | | 50 day DMA | 487.66 | | 100 day DMA | 455.92 | | 150 day DMA | 407.39 | | 200 day DMA | 347.49 | EMA (exponential moving average) of V Marc VMARCIND_SM
| EMA period | EMA current | EMA prev | EMA prev2 | | 5 day EMA | 579.59 | 583.19 | 581.59 | | 12 day EMA | 564.72 | 563.32 | 559.13 | | 20 day EMA | 542.32 | 539.15 | 534.18 | | 35 day EMA | 518.43 | 515.25 | 511.06 | | 50 day EMA | 493.84 | 490.64 | 486.73 |
SMA (simple moving average) of V Marc VMARCIND_SM
| SMA period | SMA current | SMA prev | SMA prev2 | | 5 day SMA | 582.23 | 589.18 | 594.38 | | 12 day SMA | 580.53 | 575.66 | 566.47 | | 20 day SMA | 527.39 | 520.52 | 512.34 | | 35 day SMA | 491.39 | 488.33 | 484.96 | | 50 day SMA | 487.66 | 485.45 | 482.98 | | 100 day SMA | 455.92 | 454.45 | 452.64 | | 150 day SMA | 407.39 | 404.74 | 401.95 | | 200 day SMA | 347.49 | 345.12 | 342.67 |
|
|
