VlsFinance VLSFINANCE full analysis,charts,indicators,moving averages,SMA,DMA,EMA,ADX,MACD,RSIVls Finance VLSFINANCE WideScreen charts, DMA,SMA,EMA technical analysis, forecast prediction, by indicators ADX,MACD,RSI,CCI NSE stock exchange
operates under Other Financial Services sector
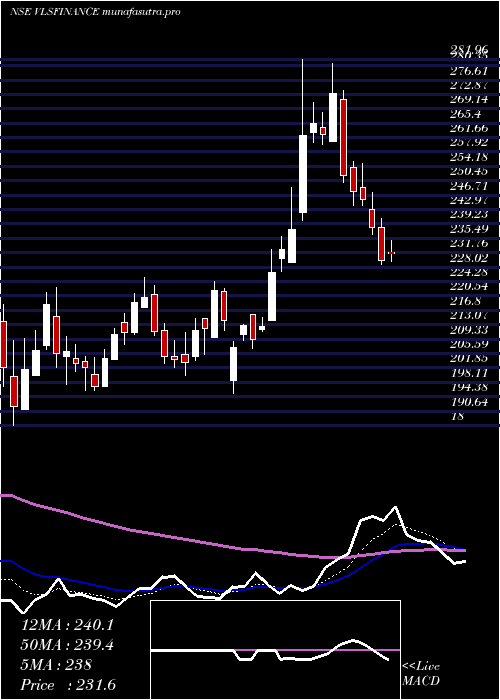
Daily price and charts and targets VlsFinance Strong Daily Stock price targets for VlsFinance VLSFINANCE are 213.56 and 222.65 | Daily Target 1 | 206.28 | | Daily Target 2 | 211.75 | | Daily Target 3 | 215.37333333333 | | Daily Target 4 | 220.84 | | Daily Target 5 | 224.46 |
Daily price and volume Vls Finance
| Date |
Closing |
Open |
Range |
Volume |
Tue 28 October 2025 |
217.21 (0.33%) |
215.10 |
209.91 - 219.00 |
0.6246 times |
Mon 27 October 2025 |
216.49 (-1.3%) |
216.00 |
215.20 - 219.12 |
0.5524 times |
Fri 24 October 2025 |
219.34 (1%) |
220.40 |
215.00 - 223.17 |
0.9277 times |
Thu 23 October 2025 |
217.17 (-0.31%) |
221.00 |
215.42 - 223.99 |
1.1892 times |
Tue 21 October 2025 |
217.85 (0.19%) |
216.35 |
213.61 - 218.86 |
0.335 times |
Mon 20 October 2025 |
217.43 (2.6%) |
213.70 |
211.31 - 221.28 |
1.0147 times |
Fri 17 October 2025 |
211.91 (0.35%) |
213.10 |
210.01 - 214.78 |
0.9365 times |
Thu 16 October 2025 |
211.17 (-0.15%) |
210.15 |
209.51 - 214.99 |
1.642 times |
Wed 15 October 2025 |
211.49 (-1.05%) |
214.31 |
206.80 - 216.26 |
2.3202 times |
Tue 14 October 2025 |
213.73 (-1.92%) |
219.29 |
213.00 - 219.29 |
0.4577 times |
Mon 13 October 2025 |
217.92 (-0.73%) |
219.14 |
217.25 - 220.19 |
0.484 times |
Weekly price and charts VlsFinance Strong weekly Stock price targets for VlsFinance VLSFINANCE are 213.56 and 222.77 | Weekly Target 1 | 206.2 | | Weekly Target 2 | 211.71 | | Weekly Target 3 | 215.41333333333 | | Weekly Target 4 | 220.92 | | Weekly Target 5 | 224.62 |
Weekly price and volumes for Vls Finance
| Date |
Closing |
Open |
Range |
Volume |
Tue 28 October 2025 |
217.21 (-0.97%) |
216.00 |
209.91 - 219.12 |
0.2951 times |
Fri 24 October 2025 |
219.34 (3.51%) |
213.70 |
211.31 - 223.99 |
0.8692 times |
Fri 17 October 2025 |
211.91 (-3.47%) |
219.14 |
206.80 - 220.19 |
1.4644 times |
Fri 10 October 2025 |
219.53 (-0.44%) |
220.99 |
218.50 - 225.00 |
0.7492 times |
Fri 03 October 2025 |
220.49 (0.25%) |
218.00 |
212.21 - 225.20 |
0.8984 times |
Fri 26 September 2025 |
219.93 (-3.88%) |
228.81 |
218.50 - 231.30 |
0.8586 times |
Fri 19 September 2025 |
228.81 (3.83%) |
221.00 |
219.25 - 233.49 |
2.4569 times |
Fri 12 September 2025 |
220.36 (-1.21%) |
223.00 |
220.00 - 225.57 |
0.9391 times |
Fri 05 September 2025 |
223.07 (0.73%) |
221.00 |
216.99 - 227.48 |
0.9426 times |
Fri 29 August 2025 |
221.45 (-4.43%) |
231.59 |
219.01 - 234.39 |
0.5264 times |
Fri 22 August 2025 |
231.72 (0.68%) |
230.50 |
226.00 - 237.45 |
1.1368 times |
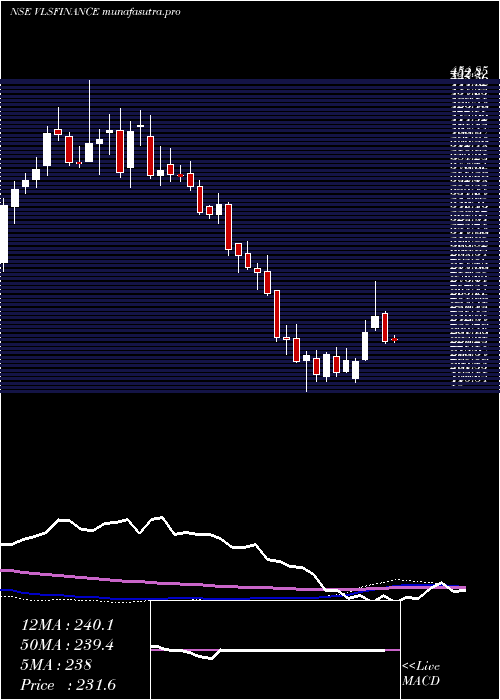
Monthly price and charts VlsFinance Strong monthly Stock price targets for VlsFinance VLSFINANCE are 212.01 and 230.41 | Monthly Target 1 | 198 | | Monthly Target 2 | 207.61 | | Monthly Target 3 | 216.40333333333 | | Monthly Target 4 | 226.01 | | Monthly Target 5 | 234.8 |
Monthly price and volumes Vls Finance
| Date |
Closing |
Open |
Range |
Volume |
Tue 28 October 2025 |
217.21 (1.17%) |
215.00 |
206.80 - 225.20 |
0.5559 times |
Tue 30 September 2025 |
214.70 (-3.05%) |
221.00 |
212.21 - 233.49 |
0.7659 times |
Fri 29 August 2025 |
221.45 (-5.06%) |
233.00 |
219.01 - 245.00 |
0.6774 times |
Thu 31 July 2025 |
233.26 (-6.63%) |
248.15 |
226.95 - 259.00 |
0.6066 times |
Mon 30 June 2025 |
249.83 (4.73%) |
239.75 |
234.91 - 264.00 |
0.6433 times |
Fri 30 May 2025 |
238.55 (0.13%) |
238.24 |
214.36 - 274.01 |
1.0311 times |
Wed 30 April 2025 |
238.24 (17.26%) |
204.84 |
195.14 - 281.96 |
1.4244 times |
Fri 28 March 2025 |
203.17 (-4.73%) |
213.80 |
186.90 - 225.29 |
1.8332 times |
Fri 28 February 2025 |
213.25 (-26.34%) |
289.90 |
211.75 - 304.00 |
1.2758 times |
Fri 31 January 2025 |
289.50 (-14.37%) |
338.10 |
274.55 - 357.20 |
1.1864 times |
Tue 31 December 2024 |
338.10 (-9.5%) |
372.90 |
331.30 - 384.70 |
1.229 times |
DMA SMA EMA moving averages of Vls Finance VLSFINANCE
DMA (daily moving average) of Vls Finance VLSFINANCE
| DMA period | DMA value | | 5 day DMA | 217.61 | | 12 day DMA | 215.94 | | 20 day DMA | 217.37 | | 35 day DMA | 220.1 | | 50 day DMA | 222.17 | | 100 day DMA | 232.57 | | 150 day DMA | 233.76 | | 200 day DMA | 239.9 | EMA (exponential moving average) of Vls Finance VLSFINANCE
| EMA period | EMA current | EMA prev | EMA prev2 | | 5 day EMA | 217.07 | 217 | 217.26 | | 12 day EMA | 217.04 | 217.01 | 217.11 | | 20 day EMA | 217.98 | 218.06 | 218.22 | | 35 day EMA | 219.99 | 220.15 | 220.37 | | 50 day EMA | 222.5 | 222.72 | 222.97 |
SMA (simple moving average) of Vls Finance VLSFINANCE
| SMA period | SMA current | SMA prev | SMA prev2 | | 5 day SMA | 217.61 | 217.66 | 216.74 | | 12 day SMA | 215.94 | 216.08 | 216.35 | | 20 day SMA | 217.37 | 217.51 | 217.72 | | 35 day SMA | 220.1 | 220.27 | 220.44 | | 50 day SMA | 222.17 | 222.54 | 222.83 | | 100 day SMA | 232.57 | 232.8 | 233.04 | | 150 day SMA | 233.76 | 233.72 | 233.64 | | 200 day SMA | 239.9 | 240.47 | 241.13 |
|
|
