VivoCollab VIVO_SM full analysis,charts,indicators,moving averages,SMA,DMA,EMA,ADX,MACD,RSIVivo Collab VIVO_SM WideScreen charts, DMA,SMA,EMA technical analysis, forecast prediction, by indicators ADX,MACD,RSI,CCI NSE stock exchange
Daily price and charts and targets VivoCollab Strong Daily Stock price targets for VivoCollab VIVO_SM are 76.05 and 76.05 | Daily Target 1 | 76.05 | | Daily Target 2 | 76.05 | | Daily Target 3 | 76.05 | | Daily Target 4 | 76.05 | | Daily Target 5 | 76.05 |
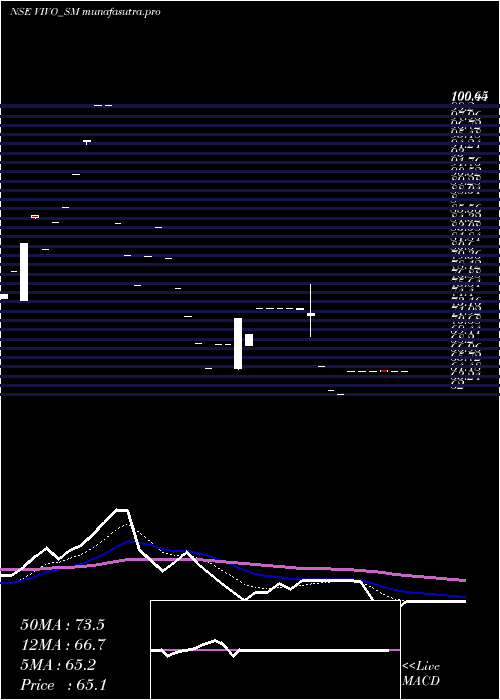
Daily price and volume Vivo Collab
| Date |
Closing |
Open |
Range |
Volume |
Tue 28 October 2025 |
76.05 (-2%) |
76.05 |
76.05 - 76.05 |
0.7143 times |
Fri 24 October 2025 |
77.60 (3.47%) |
77.60 |
77.60 - 77.60 |
0.7143 times |
Mon 20 October 2025 |
75.00 (1.35%) |
75.00 |
75.00 - 75.00 |
0.7143 times |
Thu 09 October 2025 |
74.00 (4.96%) |
74.00 |
74.00 - 74.00 |
0.7143 times |
Fri 26 September 2025 |
70.50 (4.91%) |
70.50 |
70.50 - 70.50 |
0.7143 times |
Wed 24 September 2025 |
67.20 (5%) |
67.20 |
67.20 - 67.20 |
0.7143 times |
Fri 12 September 2025 |
64.00 (-3.03%) |
64.00 |
64.00 - 64.00 |
1.4286 times |
Thu 04 September 2025 |
66.00 (-2.58%) |
66.00 |
66.00 - 66.00 |
0.7143 times |
Mon 01 September 2025 |
67.75 (0.82%) |
65.50 |
65.50 - 70.55 |
2.1429 times |
Fri 29 August 2025 |
67.20 (3.38%) |
68.25 |
67.20 - 68.25 |
1.4286 times |
Tue 26 August 2025 |
65.00 (-2.4%) |
66.00 |
65.00 - 67.00 |
2.8571 times |
Weekly price and charts VivoCollab Strong weekly Stock price targets for VivoCollab VIVO_SM are 76.05 and 76.05 | Weekly Target 1 | 76.05 | | Weekly Target 2 | 76.05 | | Weekly Target 3 | 76.05 | | Weekly Target 4 | 76.05 | | Weekly Target 5 | 76.05 |
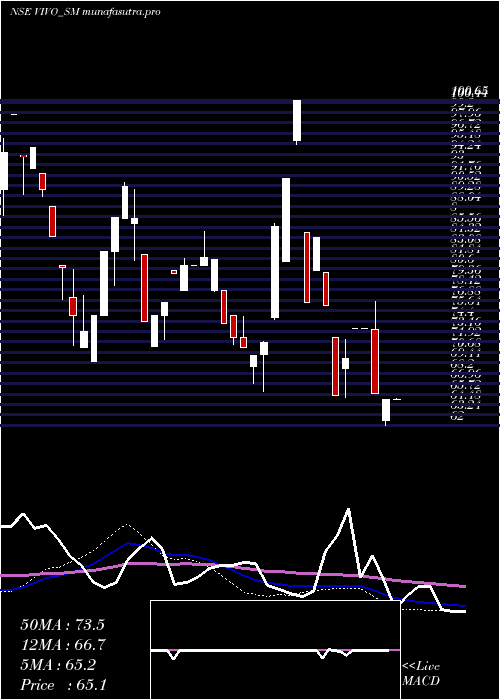
Weekly price and volumes for Vivo Collab
| Date |
Closing |
Open |
Range |
Volume |
Tue 28 October 2025 |
76.05 (-2%) |
76.05 |
76.05 - 76.05 |
0.2273 times |
Fri 24 October 2025 |
77.60 (4.86%) |
75.00 |
75.00 - 77.60 |
0.4545 times |
Thu 09 October 2025 |
74.00 (4.96%) |
74.00 |
74.00 - 74.00 |
0.2273 times |
Fri 26 September 2025 |
70.50 (10.16%) |
67.20 |
67.20 - 70.50 |
0.4545 times |
Fri 12 September 2025 |
64.00 (-4.76%) |
65.50 |
64.00 - 70.55 |
1.3636 times |
Fri 29 August 2025 |
67.20 (5%) |
66.00 |
65.00 - 68.25 |
2.5 times |
Fri 22 August 2025 |
64.00 (0%) |
67.20 |
64.00 - 67.20 |
1.5909 times |
Fri 01 August 2025 |
64.00 (0%) |
64.00 |
64.00 - 64.00 |
0.4545 times |
Thu 12 June 2025 |
64.00 (-1.69%) |
63.00 |
63.00 - 64.00 |
0.4545 times |
Fri 23 May 2025 |
65.10 (0%) |
65.10 |
65.10 - 65.20 |
2.2727 times |
Fri 16 May 2025 |
65.10 (-1.06%) |
62.55 |
62.00 - 65.10 |
2.5 times |
Monthly price and charts VivoCollab Strong monthly Stock price targets for VivoCollab VIVO_SM are 75.03 and 78.63 | Monthly Target 1 | 72.28 | | Monthly Target 2 | 74.17 | | Monthly Target 3 | 75.883333333333 | | Monthly Target 4 | 77.77 | | Monthly Target 5 | 79.48 |
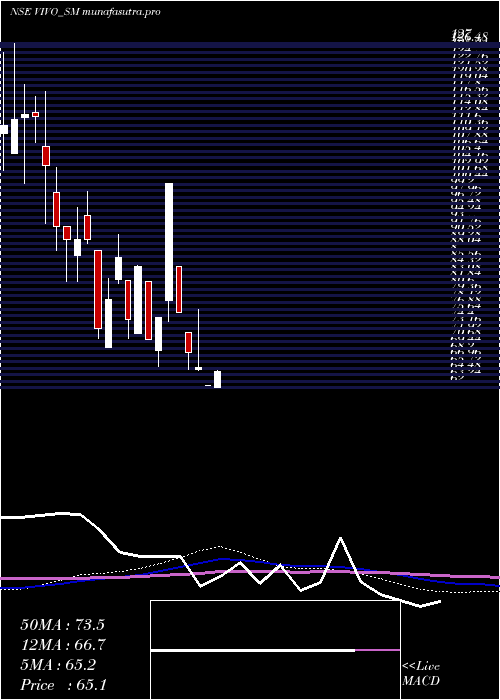
Monthly price and volumes Vivo Collab
| Date |
Closing |
Open |
Range |
Volume |
Tue 28 October 2025 |
76.05 (7.87%) |
74.00 |
74.00 - 77.60 |
0.4494 times |
Fri 26 September 2025 |
70.50 (4.91%) |
65.50 |
64.00 - 70.55 |
0.8989 times |
Fri 29 August 2025 |
67.20 (5%) |
64.00 |
64.00 - 68.25 |
2.1348 times |
Tue 15 July 2025 |
64.00 (0%) |
64.00 |
64.00 - 64.00 |
0.1124 times |
Thu 12 June 2025 |
64.00 (-1.69%) |
63.00 |
63.00 - 64.00 |
0.2247 times |
Fri 23 May 2025 |
65.10 (4.08%) |
62.00 |
62.00 - 65.20 |
2.2472 times |
Mon 07 April 2025 |
62.55 (-4.94%) |
62.55 |
62.55 - 62.55 |
0.1124 times |
Fri 28 March 2025 |
65.80 (-4.29%) |
65.50 |
65.35 - 76.75 |
2.2472 times |
Tue 25 February 2025 |
68.75 (-9.78%) |
72.50 |
65.50 - 72.50 |
0.6742 times |
Wed 29 January 2025 |
76.20 (-24.25%) |
84.90 |
76.20 - 84.90 |
0.8989 times |
Wed 16 October 2024 |
100.60 (33.51%) |
78.45 |
74.55 - 100.65 |
3.7079 times |
DMA SMA EMA moving averages of Vivo Collab VIVO_SM
DMA (daily moving average) of Vivo Collab VIVO_SM
| DMA period | DMA value | | 5 day DMA | 74.63 | | 12 day DMA | 69.74 | | 20 day DMA | 67.77 | | 35 day DMA | 68.05 | | 50 day DMA | 71.26 | | 100 day DMA | 75.11 | | 150 day DMA | 78.56 | | 200 day DMA | 85.55 | EMA (exponential moving average) of Vivo Collab VIVO_SM
| EMA period | EMA current | EMA prev | EMA prev2 | | 5 day EMA | 74.37 | 73.53 | 71.49 | | 12 day EMA | 71.15 | 70.26 | 68.93 | | 20 day EMA | 69.97 | 69.33 | 68.46 | | 35 day EMA | 71.12 | 70.83 | 70.43 | | 50 day EMA | 72.99 | 72.87 | 72.68 |
SMA (simple moving average) of Vivo Collab VIVO_SM
| SMA period | SMA current | SMA prev | SMA prev2 | | 5 day SMA | 74.63 | 72.86 | 70.14 | | 12 day SMA | 69.74 | 68.74 | 67.87 | | 20 day SMA | 67.77 | 67.23 | 66.6 | | 35 day SMA | 68.05 | 67.94 | 67.68 | | 50 day SMA | 71.26 | 71.65 | 71.93 | | 100 day SMA | 75.11 | 75.14 | 75.11 | | 150 day SMA | 78.56 | 78.67 | 78.74 | | 200 day SMA | 85.55 | 85.75 | 85.91 |
|
|
