VisagarPolytex VIVIDHA full analysis,charts,indicators,moving averages,SMA,DMA,EMA,ADX,MACD,RSIVisagar Polytex VIVIDHA WideScreen charts, DMA,SMA,EMA technical analysis, forecast prediction, by indicators ADX,MACD,RSI,CCI NSE stock exchange
operates under Textiles sector
Daily price and charts and targets VisagarPolytex Strong Daily Stock price targets for VisagarPolytex VIVIDHA are 0.72 and 0.9 | Daily Target 1 | 0.57 | | Daily Target 2 | 0.68 | | Daily Target 3 | 0.74666666666667 | | Daily Target 4 | 0.86 | | Daily Target 5 | 0.93 |
Daily price and volume Visagar Polytex
| Date |
Closing |
Open |
Range |
Volume |
Tue 28 October 2025 |
0.80 (2.56%) |
0.79 |
0.63 - 0.81 |
1.4873 times |
Mon 27 October 2025 |
0.78 (-1.27%) |
0.79 |
0.78 - 0.80 |
0.5019 times |
Fri 24 October 2025 |
0.79 (0%) |
0.80 |
0.79 - 0.80 |
0.5189 times |
Thu 23 October 2025 |
0.79 (5.33%) |
0.77 |
0.76 - 0.80 |
1.9889 times |
Tue 21 October 2025 |
0.75 (0%) |
0.75 |
0.75 - 0.82 |
0.57 times |
Mon 20 October 2025 |
0.75 (1.35%) |
0.75 |
0.75 - 0.76 |
0.6851 times |
Fri 17 October 2025 |
0.74 (-1.33%) |
0.75 |
0.74 - 0.76 |
0.9757 times |
Thu 16 October 2025 |
0.75 (-1.32%) |
0.77 |
0.74 - 0.77 |
1.493 times |
Wed 15 October 2025 |
0.76 (1.33%) |
0.76 |
0.76 - 0.77 |
1.0604 times |
Tue 14 October 2025 |
0.75 (-1.32%) |
0.77 |
0.75 - 0.78 |
0.7188 times |
Mon 13 October 2025 |
0.76 (-1.3%) |
0.77 |
0.75 - 0.78 |
0.6154 times |
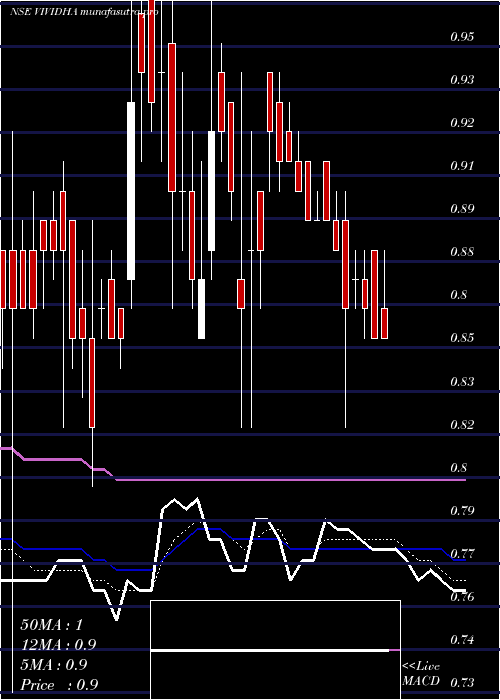
Weekly price and charts VisagarPolytex Strong weekly Stock price targets for VisagarPolytex VIVIDHA are 0.72 and 0.9 | Weekly Target 1 | 0.57 | | Weekly Target 2 | 0.68 | | Weekly Target 3 | 0.74666666666667 | | Weekly Target 4 | 0.86 | | Weekly Target 5 | 0.93 |
Weekly price and volumes for Visagar Polytex
| Date |
Closing |
Open |
Range |
Volume |
Tue 28 October 2025 |
0.80 (1.27%) |
0.79 |
0.63 - 0.81 |
0.4442 times |
Fri 24 October 2025 |
0.79 (6.76%) |
0.75 |
0.75 - 0.82 |
0.8403 times |
Fri 17 October 2025 |
0.74 (-3.9%) |
0.77 |
0.74 - 0.78 |
1.086 times |
Fri 10 October 2025 |
0.77 (-3.75%) |
0.80 |
0.75 - 0.82 |
0.8234 times |
Fri 03 October 2025 |
0.80 (5.26%) |
0.81 |
0.76 - 0.91 |
1.9438 times |
Fri 26 September 2025 |
0.76 (-9.52%) |
0.83 |
0.73 - 0.85 |
1.002 times |
Fri 19 September 2025 |
0.84 (7.69%) |
0.79 |
0.77 - 0.88 |
1.669 times |
Fri 12 September 2025 |
0.78 (0%) |
0.78 |
0.75 - 0.81 |
0.8407 times |
Fri 05 September 2025 |
0.78 (-4.88%) |
0.82 |
0.72 - 0.83 |
0.6081 times |
Fri 29 August 2025 |
0.82 (1.23%) |
0.81 |
0.78 - 0.87 |
0.7426 times |
Fri 22 August 2025 |
0.81 (15.71%) |
0.71 |
0.60 - 0.88 |
1.6352 times |
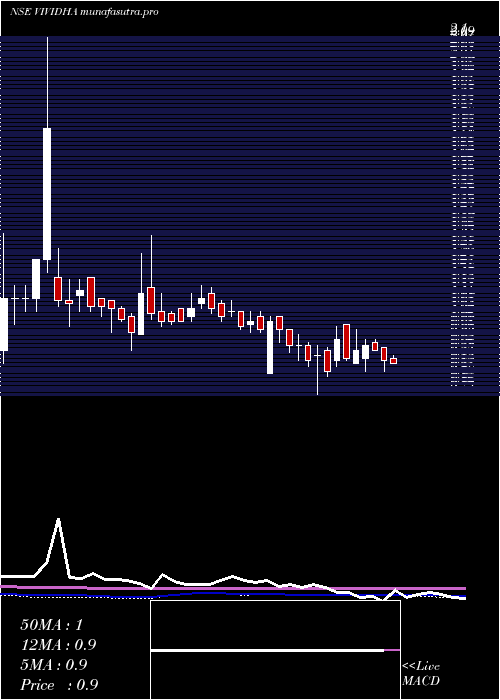
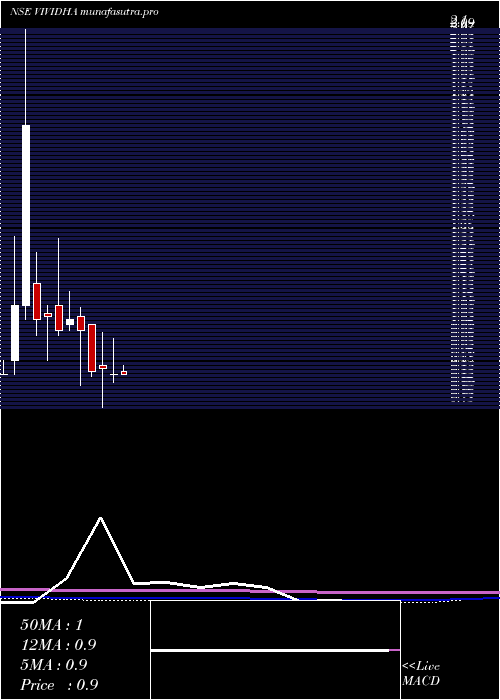
Monthly price and charts VisagarPolytex Strong monthly Stock price targets for VisagarPolytex VIVIDHA are 0.61 and 0.82 | Monthly Target 1 | 0.55 | | Monthly Target 2 | 0.67 | | Monthly Target 3 | 0.75666666666667 | | Monthly Target 4 | 0.88 | | Monthly Target 5 | 0.97 |
Monthly price and volumes Visagar Polytex
| Date |
Closing |
Open |
Range |
Volume |
Tue 28 October 2025 |
0.80 (-2.44%) |
0.82 |
0.63 - 0.84 |
0.8144 times |
Tue 30 September 2025 |
0.82 (0%) |
0.82 |
0.72 - 0.91 |
1.2527 times |
Fri 29 August 2025 |
0.82 (3.8%) |
0.80 |
0.60 - 0.88 |
1.1051 times |
Thu 31 July 2025 |
0.79 (-7.06%) |
0.85 |
0.77 - 0.91 |
0.9467 times |
Mon 30 June 2025 |
0.85 (-1.16%) |
0.87 |
0.82 - 0.92 |
1.0015 times |
Fri 30 May 2025 |
0.86 (1.18%) |
0.86 |
0.76 - 1.05 |
1.0862 times |
Wed 30 April 2025 |
0.85 (-2.3%) |
0.85 |
0.82 - 0.98 |
0.6782 times |
Fri 28 March 2025 |
0.87 (1.16%) |
0.88 |
0.73 - 1.00 |
1.0657 times |
Fri 28 February 2025 |
0.86 (-14.85%) |
1.03 |
0.84 - 1.03 |
0.7085 times |
Fri 31 January 2025 |
1.01 (-3.81%) |
1.06 |
0.81 - 1.09 |
1.3411 times |
Tue 31 December 2024 |
1.05 (3.96%) |
1.03 |
1.01 - 1.15 |
1.7314 times |
DMA SMA EMA moving averages of Visagar Polytex VIVIDHA
DMA (daily moving average) of Visagar Polytex VIVIDHA
| DMA period | DMA value | | 5 day DMA | 0.78 | | 12 day DMA | 0.77 | | 20 day DMA | 0.78 | | 35 day DMA | 0.79 | | 50 day DMA | 0.79 | | 100 day DMA | 0.81 | | 150 day DMA | 0.83 | | 200 day DMA | 0.86 | EMA (exponential moving average) of Visagar Polytex VIVIDHA
| EMA period | EMA current | EMA prev | EMA prev2 | | 5 day EMA | 0.78 | 0.77 | 0.77 | | 12 day EMA | 0.77 | 0.77 | 0.77 | | 20 day EMA | 0.79 | 0.79 | 0.79 | | 35 day EMA | 0.79 | 0.79 | 0.79 | | 50 day EMA | 0.78 | 0.78 | 0.78 |
SMA (simple moving average) of Visagar Polytex VIVIDHA
| SMA period | SMA current | SMA prev | SMA prev2 | | 5 day SMA | 0.78 | 0.77 | 0.76 | | 12 day SMA | 0.77 | 0.76 | 0.76 | | 20 day SMA | 0.78 | 0.78 | 0.78 | | 35 day SMA | 0.79 | 0.79 | 0.79 | | 50 day SMA | 0.79 | 0.79 | 0.79 | | 100 day SMA | 0.81 | 0.81 | 0.81 | | 150 day SMA | 0.83 | 0.83 | 0.83 | | 200 day SMA | 0.86 | 0.86 | 0.86 |
|
|
