VivianaPower VIVIANA_SM full analysis,charts,indicators,moving averages,SMA,DMA,EMA,ADX,MACD,RSIViviana Power VIVIANA_SM WideScreen charts, DMA,SMA,EMA technical analysis, forecast prediction, by indicators ADX,MACD,RSI,CCI NSE stock exchange
Daily price and charts and targets VivianaPower Strong Daily Stock price targets for VivianaPower VIVIANA_SM are 1641.18 and 1689.08 | Daily Target 1 | 1631.52 | | Daily Target 2 | 1650.83 | | Daily Target 3 | 1679.4166666667 | | Daily Target 4 | 1698.73 | | Daily Target 5 | 1727.32 |
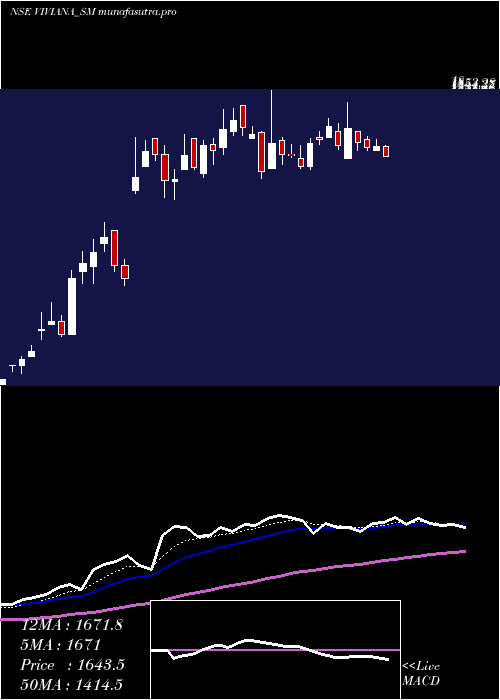
Daily price and volume Viviana Power
| Date |
Closing |
Open |
Range |
Volume |
Tue 28 October 2025 |
1670.15 (-1.14%) |
1699.00 |
1660.10 - 1708.00 |
0.5133 times |
Mon 27 October 2025 |
1689.45 (-2.64%) |
1725.00 |
1660.00 - 1725.00 |
1.3142 times |
Fri 24 October 2025 |
1735.30 (3.31%) |
1636.00 |
1635.00 - 1818.00 |
2.6694 times |
Thu 23 October 2025 |
1679.65 (-3.59%) |
1725.50 |
1665.05 - 1750.00 |
0.7187 times |
Tue 21 October 2025 |
1742.25 (2.7%) |
1705.10 |
1705.10 - 1767.00 |
0.4723 times |
Mon 20 October 2025 |
1696.40 (0.62%) |
1705.00 |
1680.10 - 1725.00 |
0.8419 times |
Fri 17 October 2025 |
1685.95 (4.82%) |
1608.45 |
1600.00 - 1699.90 |
1.6016 times |
Thu 16 October 2025 |
1608.45 (-2.2%) |
1636.40 |
1602.10 - 1678.95 |
0.462 times |
Wed 15 October 2025 |
1644.60 (-0.14%) |
1646.85 |
1640.00 - 1680.00 |
0.6571 times |
Tue 14 October 2025 |
1646.85 (-2.26%) |
1693.00 |
1617.15 - 1705.00 |
0.7495 times |
Mon 13 October 2025 |
1684.90 (5.9%) |
1601.00 |
1601.00 - 1860.00 |
4.8665 times |
Weekly price and charts VivianaPower Strong weekly Stock price targets for VivianaPower VIVIANA_SM are 1632.58 and 1697.58 | Weekly Target 1 | 1620.05 | | Weekly Target 2 | 1645.1 | | Weekly Target 3 | 1685.05 | | Weekly Target 4 | 1710.1 | | Weekly Target 5 | 1750.05 |
Weekly price and volumes for Viviana Power
| Date |
Closing |
Open |
Range |
Volume |
Tue 28 October 2025 |
1670.15 (-3.75%) |
1725.00 |
1660.00 - 1725.00 |
0.2458 times |
Fri 24 October 2025 |
1735.30 (2.93%) |
1705.00 |
1635.00 - 1818.00 |
0.6323 times |
Fri 17 October 2025 |
1685.95 (5.96%) |
1601.00 |
1600.00 - 1860.00 |
1.1211 times |
Fri 10 October 2025 |
1591.10 (-4.26%) |
1670.25 |
1570.00 - 1809.95 |
1.0562 times |
Fri 03 October 2025 |
1661.95 (6.08%) |
1600.00 |
1571.30 - 1714.95 |
0.6365 times |
Fri 26 September 2025 |
1566.70 (26.18%) |
1530.00 |
1501.10 - 1705.00 |
1.3724 times |
Wed 18 June 2025 |
1241.60 (-6.26%) |
1355.00 |
1217.00 - 1424.95 |
1.2398 times |
Fri 13 June 2025 |
1324.55 (23.54%) |
1090.00 |
1050.00 - 1370.00 |
2.1055 times |
Fri 06 June 2025 |
1072.15 (34.19%) |
891.00 |
891.00 - 1130.00 |
1.1874 times |
Tue 08 October 2024 |
799.00 (-7.63%) |
825.05 |
740.00 - 854.00 |
0.4031 times |
Fri 12 July 2024 |
865.00 (-21.15%) |
1055.00 |
848.95 - 1089.95 |
1.0438 times |

Monthly price and charts VivianaPower Strong monthly Stock price targets for VivianaPower VIVIANA_SM are 1620.08 and 1910.08 | Monthly Target 1 | 1410.05 | | Monthly Target 2 | 1540.1 | | Monthly Target 3 | 1700.05 | | Monthly Target 4 | 1830.1 | | Monthly Target 5 | 1990.05 |
Monthly price and volumes Viviana Power
| Date |
Closing |
Open |
Range |
Volume |
Tue 28 October 2025 |
1670.15 (3.91%) |
1585.00 |
1570.00 - 1860.00 |
0.8692 times |
Tue 30 September 2025 |
1607.35 (29.46%) |
1530.00 |
1501.10 - 1714.95 |
0.4543 times |
Wed 18 June 2025 |
1241.60 (55.39%) |
891.00 |
891.00 - 1424.95 |
1.1846 times |
Tue 08 October 2024 |
799.00 (-3.1%) |
750.00 |
740.00 - 799.00 |
0.0144 times |
Mon 15 July 2024 |
824.55 (-6.79%) |
924.95 |
821.75 - 1097.15 |
0.7491 times |
Fri 28 June 2024 |
884.60 (35.47%) |
685.65 |
585.65 - 943.25 |
1.4563 times |
Fri 31 May 2024 |
653.00 (36.87%) |
500.95 |
491.75 - 746.00 |
2.1115 times |
Tue 30 April 2024 |
477.10 (45.02%) |
356.50 |
356.00 - 477.10 |
0.3204 times |
Tue 30 January 2024 |
329.00 (83.9%) |
189.20 |
180.00 - 339.80 |
1.4692 times |
Fri 29 December 2023 |
178.90 (11.81%) |
159.20 |
159.20 - 209.90 |
1.3711 times |
Thu 30 November 2023 |
160.00 (12.4%) |
139.30 |
131.05 - 168.00 |
0.9728 times |

DMA SMA EMA moving averages of Viviana Power VIVIANA_SM
DMA (daily moving average) of Viviana Power VIVIANA_SM
| DMA period | DMA value | | 5 day DMA | 1703.36 | | 12 day DMA | 1672.92 | | 20 day DMA | 1680.51 | | 35 day DMA | 1531.43 | | 50 day DMA | 1356.09 | | 100 day DMA | 989.17 | | 150 day DMA | 728.32 | | 200 day DMA | 583.88 | EMA (exponential moving average) of Viviana Power VIVIANA_SM
| EMA period | EMA current | EMA prev | EMA prev2 | | 5 day EMA | 1689.76 | 1699.56 | 1704.61 | | 12 day EMA | 1677.29 | 1678.59 | 1676.62 | | 20 day EMA | 1633.37 | 1629.5 | 1623.19 | | 35 day EMA | 1497.26 | 1487.08 | 1475.17 | | 50 day EMA | 1349.89 | 1336.82 | 1322.43 |
SMA (simple moving average) of Viviana Power VIVIANA_SM
| SMA period | SMA current | SMA prev | SMA prev2 | | 5 day SMA | 1703.36 | 1708.61 | 1707.91 | | 12 day SMA | 1672.92 | 1676.57 | 1680.68 | | 20 day SMA | 1680.51 | 1675.33 | 1668.94 | | 35 day SMA | 1531.43 | 1511.51 | 1490.49 | | 50 day SMA | 1356.09 | 1340.38 | 1323.44 | | 100 day SMA | 989.17 | 975.47 | 961.66 | | 150 day SMA | 728.32 | 718.23 | 708.06 | | 200 day SMA | 583.88 | 576.3 | 568.64 |
|
|
