VisamanGlobal VISAMAN_ST full analysis,charts,indicators,moving averages,SMA,DMA,EMA,ADX,MACD,RSIVisaman Global VISAMAN_ST WideScreen charts, DMA,SMA,EMA technical analysis, forecast prediction, by indicators ADX,MACD,RSI,CCI NSE stock exchange
Daily price and charts and targets VisamanGlobal Strong Daily Stock price targets for VisamanGlobal VISAMAN_ST are 117.6 and 122.4 | Daily Target 1 | 116.8 | | Daily Target 2 | 118.4 | | Daily Target 3 | 121.6 | | Daily Target 4 | 123.2 | | Daily Target 5 | 126.4 |
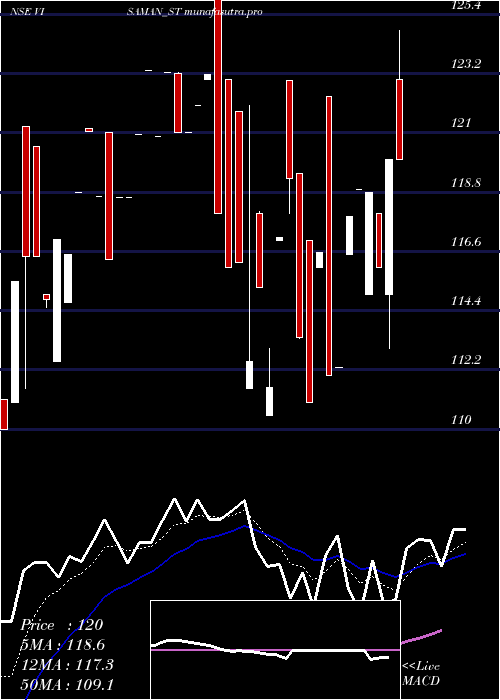
Daily price and volume Visaman Global
| Date |
Closing |
Open |
Range |
Volume |
Tue 09 December 2025 |
120.00 (0%) |
123.00 |
120.00 - 124.80 |
0.2158 times |
Mon 08 December 2025 |
120.00 (3.45%) |
115.00 |
113.00 - 120.00 |
0.7194 times |
Thu 04 December 2025 |
116.00 (-2.36%) |
118.00 |
116.00 - 118.00 |
0.1439 times |
Tue 02 December 2025 |
118.80 (-0.08%) |
115.00 |
115.00 - 118.80 |
0.7194 times |
Fri 21 November 2025 |
118.90 (0.85%) |
118.90 |
118.90 - 118.90 |
0.0719 times |
Thu 20 November 2025 |
117.90 (4.99%) |
116.50 |
116.50 - 117.90 |
0.2158 times |
Wed 19 November 2025 |
112.30 (0.27%) |
112.30 |
112.30 - 112.30 |
7.1942 times |
Tue 18 November 2025 |
112.00 (-3.9%) |
122.35 |
112.00 - 122.35 |
0.2158 times |
Thu 13 November 2025 |
116.55 (5%) |
116.00 |
116.00 - 116.55 |
0.2158 times |
Tue 11 November 2025 |
111.00 (-2.12%) |
117.00 |
111.00 - 117.00 |
0.2878 times |
Mon 10 November 2025 |
113.40 (-4.95%) |
119.50 |
113.35 - 119.50 |
0.4317 times |
Weekly price and charts VisamanGlobal Strong weekly Stock price targets for VisamanGlobal VISAMAN_ST are 116.5 and 128.3 | Weekly Target 1 | 107.47 | | Weekly Target 2 | 113.73 | | Weekly Target 3 | 119.26666666667 | | Weekly Target 4 | 125.53 | | Weekly Target 5 | 131.07 |
Weekly price and volumes for Visaman Global
| Date |
Closing |
Open |
Range |
Volume |
Tue 09 December 2025 |
120.00 (3.45%) |
115.00 |
113.00 - 124.80 |
0.4643 times |
Thu 04 December 2025 |
116.00 (-2.44%) |
115.00 |
115.00 - 118.80 |
0.4286 times |
Fri 21 November 2025 |
118.90 (2.02%) |
122.35 |
112.00 - 122.35 |
3.8214 times |
Thu 13 November 2025 |
116.55 (-2.31%) |
119.50 |
111.00 - 119.50 |
0.4643 times |
Fri 07 November 2025 |
119.30 (6.04%) |
118.00 |
110.50 - 122.95 |
0.7857 times |
Fri 31 October 2025 |
112.50 (-7.79%) |
123.00 |
111.50 - 129.30 |
1.25 times |
Thu 23 October 2025 |
122.00 (0.95%) |
123.25 |
121.00 - 123.25 |
0.8571 times |
Fri 10 October 2025 |
120.85 (1.9%) |
120.95 |
120.85 - 123.30 |
0.4286 times |
Wed 01 October 2025 |
118.60 (-0.04%) |
121.00 |
116.30 - 121.00 |
0.5357 times |
Thu 25 September 2025 |
118.65 (1.37%) |
114.70 |
114.70 - 121.15 |
0.9643 times |
Fri 19 September 2025 |
117.05 (6.41%) |
111.00 |
111.00 - 121.25 |
2.4643 times |

Monthly price and charts VisamanGlobal Strong monthly Stock price targets for VisamanGlobal VISAMAN_ST are 116.5 and 128.3 | Monthly Target 1 | 107.47 | | Monthly Target 2 | 113.73 | | Monthly Target 3 | 119.26666666667 | | Monthly Target 4 | 125.53 | | Monthly Target 5 | 131.07 |
Monthly price and volumes Visaman Global
| Date |
Closing |
Open |
Range |
Volume |
Tue 09 December 2025 |
120.00 (0.93%) |
115.00 |
113.00 - 124.80 |
0.0291 times |
Fri 21 November 2025 |
118.90 (5.69%) |
118.00 |
110.50 - 122.95 |
0.1654 times |
Fri 31 October 2025 |
112.50 (-5.14%) |
118.60 |
111.50 - 129.30 |
0.0862 times |
Tue 30 September 2025 |
118.60 (33.56%) |
90.55 |
90.55 - 121.25 |
0.262 times |
Fri 29 August 2025 |
88.80 (-3.69%) |
92.20 |
79.00 - 92.20 |
0.0908 times |
Thu 31 July 2025 |
92.20 (0%) |
45.10 |
39.00 - 97.50 |
5.3665 times |
Wed 10 December 2025 |
(0%) |
|
- |
0 times |

DMA SMA EMA moving averages of Visaman Global VISAMAN_ST
DMA (daily moving average) of Visaman Global VISAMAN_ST
| DMA period | DMA value | | 5 day DMA | 118.74 | | 12 day DMA | 116.35 | | 20 day DMA | 116.3 | | 35 day DMA | 117.82 | | 50 day DMA | 113.27 | | 100 day DMA | | | 150 day DMA | | | 200 day DMA | | EMA (exponential moving average) of Visaman Global VISAMAN_ST
| EMA period | EMA current | EMA prev | EMA prev2 | | 5 day EMA | 118.55 | 117.82 | 116.73 | | 12 day EMA | 117.28 | 116.79 | 116.21 | | 20 day EMA | 116.57 | 116.21 | 115.81 | | 35 day EMA | 113.57 | 113.19 | 112.79 | | 50 day EMA | 111.41 | 111.06 | 110.7 |
SMA (simple moving average) of Visaman Global VISAMAN_ST
| SMA period | SMA current | SMA prev | SMA prev2 | | 5 day SMA | 118.74 | 118.32 | 116.78 | | 12 day SMA | 116.35 | 116.1 | 115.4 | | 20 day SMA | 116.3 | 116.4 | 116.45 | | 35 day SMA | 117.82 | 117.67 | 117.57 | | 50 day SMA | 113.27 | 112.61 | 111.92 | | 100 day SMA | | 150 day SMA | | 200 day SMA |
|
|
