VisamanGlobal VISAMAN_SM full analysis,charts,indicators,moving averages,SMA,DMA,EMA,ADX,MACD,RSIVisaman Global VISAMAN_SM WideScreen charts, DMA,SMA,EMA technical analysis, forecast prediction, by indicators ADX,MACD,RSI,CCI NSE stock exchange
Daily price and charts and targets VisamanGlobal Strong Daily Stock price targets for VisamanGlobal VISAMAN_SM are 62.48 and 73.43 | Daily Target 1 | 53.35 | | Daily Target 2 | 60.65 | | Daily Target 3 | 64.3 | | Daily Target 4 | 71.6 | | Daily Target 5 | 75.25 |
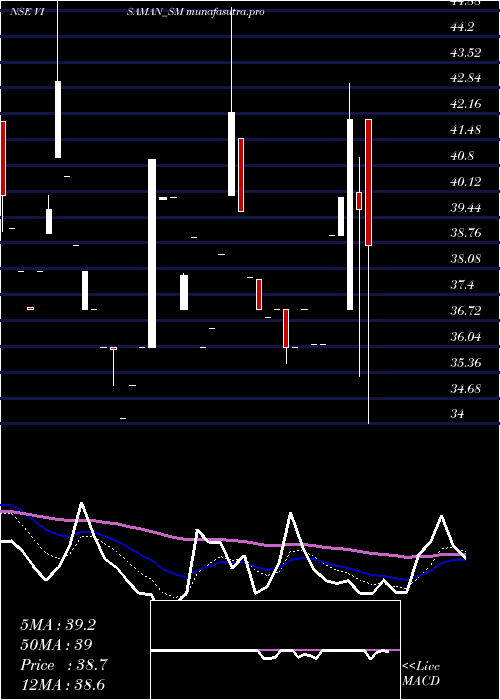
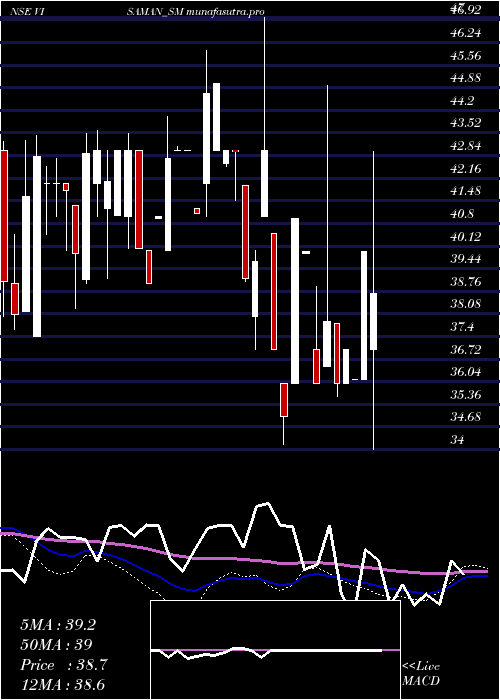
Daily price and volume Visaman Global
| Date |
Closing |
Open |
Range |
Volume |
Fri 11 July 2025 |
67.95 (19.95%) |
57.00 |
57.00 - 67.95 |
0.8604 times |
Thu 10 July 2025 |
56.65 (3.28%) |
55.55 |
54.50 - 57.90 |
0.9178 times |
Wed 09 July 2025 |
54.85 (2.14%) |
53.00 |
51.50 - 54.95 |
2.2945 times |
Tue 08 July 2025 |
53.70 (-0.46%) |
51.25 |
51.25 - 54.25 |
0.8604 times |
Mon 07 July 2025 |
53.95 (9.65%) |
51.80 |
50.00 - 54.75 |
1.109 times |
Fri 04 July 2025 |
49.20 (-0.71%) |
51.00 |
47.60 - 52.70 |
0.2677 times |
Thu 03 July 2025 |
49.55 (1.54%) |
48.50 |
47.50 - 50.00 |
0.7839 times |
Wed 02 July 2025 |
48.80 (8.2%) |
48.45 |
47.00 - 48.95 |
1.2811 times |
Tue 01 July 2025 |
45.10 (-7.01%) |
49.20 |
45.10 - 49.20 |
0.1721 times |
Mon 30 June 2025 |
48.50 (3.97%) |
48.95 |
46.00 - 49.00 |
1.4532 times |
Thu 26 June 2025 |
46.65 (1.19%) |
46.00 |
43.25 - 48.25 |
1.0325 times |
Weekly price and charts VisamanGlobal Strong weekly Stock price targets for VisamanGlobal VISAMAN_SM are 58.98 and 76.93 | Weekly Target 1 | 44.02 | | Weekly Target 2 | 55.98 | | Weekly Target 3 | 61.966666666667 | | Weekly Target 4 | 73.93 | | Weekly Target 5 | 79.92 |
Weekly price and volumes for Visaman Global
| Date |
Closing |
Open |
Range |
Volume |
Fri 11 July 2025 |
67.95 (38.11%) |
51.80 |
50.00 - 67.95 |
3.3089 times |
Fri 04 July 2025 |
49.20 (5.47%) |
48.95 |
45.10 - 52.70 |
2.1675 times |
Thu 26 June 2025 |
46.65 (5.07%) |
45.00 |
40.15 - 48.25 |
0.7958 times |
Fri 20 June 2025 |
44.40 (3.5%) |
44.95 |
39.50 - 45.00 |
0.2304 times |
Fri 13 June 2025 |
42.90 (-0.23%) |
43.00 |
34.00 - 44.00 |
0.9005 times |
Fri 06 June 2025 |
43.00 (7.5%) |
43.00 |
41.00 - 43.00 |
2.199 times |
Fri 30 May 2025 |
40.00 (3.36%) |
39.00 |
37.10 - 40.00 |
0.0628 times |
Fri 23 May 2025 |
38.70 (-3.13%) |
37.00 |
34.00 - 42.95 |
0.2723 times |
Fri 16 May 2025 |
39.95 (10.66%) |
36.10 |
36.10 - 39.95 |
0.0524 times |
Mon 05 May 2025 |
36.10 (-2.43%) |
36.10 |
36.10 - 36.10 |
0.0105 times |
Thu 24 April 2025 |
37.00 (2.78%) |
36.00 |
36.00 - 37.00 |
0.0209 times |
Monthly price and charts VisamanGlobal Strong monthly Stock price targets for VisamanGlobal VISAMAN_SM are 56.53 and 79.38 | Monthly Target 1 | 37.48 | | Monthly Target 2 | 52.72 | | Monthly Target 3 | 60.333333333333 | | Monthly Target 4 | 75.57 | | Monthly Target 5 | 83.18 |
Monthly price and volumes Visaman Global
| Date |
Closing |
Open |
Range |
Volume |
Fri 11 July 2025 |
67.95 (40.1%) |
49.20 |
45.10 - 67.95 |
2.6079 times |
Mon 30 June 2025 |
48.50 (21.25%) |
43.00 |
34.00 - 49.00 |
2.7421 times |
Fri 30 May 2025 |
40.00 (8.11%) |
36.10 |
34.00 - 42.95 |
0.2217 times |
Thu 24 April 2025 |
37.00 (2.78%) |
36.00 |
36.00 - 37.00 |
0.0117 times |
Fri 28 March 2025 |
36.00 (-12.09%) |
39.90 |
35.60 - 44.95 |
1.1377 times |
Thu 27 February 2025 |
40.95 (1.11%) |
38.70 |
34.15 - 40.95 |
0.7643 times |
Mon 27 January 2025 |
40.50 (-5.7%) |
41.95 |
37.00 - 47.00 |
0.2567 times |
Fri 27 December 2024 |
42.95 (4.5%) |
42.00 |
41.00 - 46.00 |
0.5834 times |
Thu 28 November 2024 |
41.10 (0.24%) |
40.00 |
40.00 - 44.00 |
0.4726 times |
Mon 28 October 2024 |
41.00 (-0.12%) |
42.00 |
39.00 - 43.50 |
1.2019 times |
Mon 30 September 2024 |
41.05 (-1.79%) |
41.35 |
38.25 - 43.60 |
1.2252 times |

DMA SMA EMA moving averages of Visaman Global VISAMAN_SM
DMA (daily moving average) of Visaman Global VISAMAN_SM
| DMA period | DMA value | | 5 day DMA | 57.42 | | 12 day DMA | 51.75 | | 20 day DMA | 48.36 | | 35 day DMA | 44.95 | | 50 day DMA | 42.73 | | 100 day DMA | 41.8 | | 150 day DMA | 41.71 | | 200 day DMA | | EMA (exponential moving average) of Visaman Global VISAMAN_SM
| EMA period | EMA current | EMA prev | EMA prev2 | | 5 day EMA | 58.58 | 53.89 | 52.51 | | 12 day EMA | 53.28 | 50.61 | 49.51 | | 20 day EMA | 50.12 | 48.24 | 47.36 | | 35 day EMA | 46.65 | 45.4 | 44.74 | | 50 day EMA | 43.87 | 42.89 | 42.33 |
SMA (simple moving average) of Visaman Global VISAMAN_SM
| SMA period | SMA current | SMA prev | SMA prev2 | | 5 day SMA | 57.42 | 53.67 | 52.25 | | 12 day SMA | 51.75 | 49.8 | 48.83 | | 20 day SMA | 48.36 | 46.85 | 45.97 | | 35 day SMA | 44.95 | 44.04 | 43.48 | | 50 day SMA | 42.73 | 42.17 | 41.84 | | 100 day SMA | 41.8 | 41.55 | 41.42 | | 150 day SMA | 41.71 | 41.52 | 41.4 | | 200 day SMA |
|
|
